6.19. OpenStack load testing report
| Abstract: | This document contains OpenStack load testing results collected for OpenStack load testing |
|---|
6.19.1. Environment description
Environment contains servers of the following roles:
- rally node
- controller node
- compute-osd node
- compute node
| Role | Servers count |
|---|---|
| rally | 1 |
| controller | 3 |
| compute | 176 |
| compute-osd | 20 |
6.19.1.1. Hardware configuration of each server
All servers have same configuration describing in table below
| server | vendor,model | HP,DL380 Gen9 |
| CPU | vendor,model | Intel,E5-2680 v3 |
| processor_count | 2 | |
| core_count | 12 | |
| frequency_MHz | 2500 | |
| RAM | vendor,model | HP,752369-081 |
| amount_MB | 262144 | |
| NETWORK | interface_name | p1p1 |
| vendor,model | Intel,X710 Dual Port | |
| bandwidth | 10G | |
| STORAGE | dev_name | /dev/sda |
| vendor,model | raid10 - HP P840
12 disks EH0600JEDHE
|
|
| SSD/HDD | HDD | |
| size | 3,6TB |
6.19.1.2. Network configuration of each server
All servers have same network configuration:
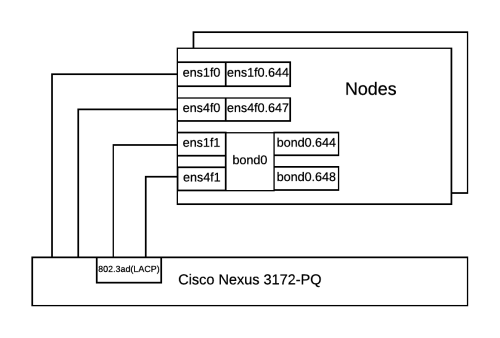
Here is the part of switch configuration for each switch port which connected to ens1f0 interface of a server:
switchport mode trunk
switchport trunk native vlan 600
switchport trunk allowed vlan 600-602,630-649
spanning-tree port type edge trunk
spanning-tree bpduguard enable
no snmp trap link-status
6.19.1.3. Software configuration on environment servers
| Role | Service name |
|---|---|
| controller | horizon
keystone
nova-api
nava-scheduler
nova-cert
nova-conductor
nova-consoleauth
nova-consoleproxy
cinder-api
cinder-backup
cinder-scheduler
cinder-volume
glance-api
glance-glare
glance-registry
neutron-dhcp-agent
neutron-l3-agent
neutron-metadata-agent
neutron-openvswitch-agent
neutron-server
heat-api
heat-api-cfn
heat-api-cloudwatch
ceph-mon
rados-gw
heat-engine
memcached
rabbitmq-server
mysqld
galera
corosync
pacemaker
haproxy
|
| compute | nova-compute
neutron-l3-agent
neutron-metadata-agent
neutron-openvswitch-agent
|
| compute-osd | nova-compute
neutron-l3-agent
neutron-metadata-agent
neutron-openvswitch-agent
ceph-osd
|
| osd | ceph-osd |
| Software | Version |
|---|---|
| OpenStack | Mitaka |
| Ceph | Hammer |
| Ubuntu | Ubuntu 14.04.3 LTS |
6.19.1.4. Software configuration on servers with rally role
On this server should be installed Rally. How to do it you can find in Rally installation documentation
| Software | Version |
|---|---|
| Rally | 0.4.0 |
| Ubuntu | Ubuntu 14.04.3 LTS |
6.19.2. Test results
6.19.2.1. Create Neutron networks
In this test case Rally creates Neutron networks at constant rate. Achieved maximum rate: 5 RPS.
| Response Times (sec) | ||||||||
| Action | Min (sec) | Median (sec) | 90%ile (sec) | 95%ile (sec) | Max (sec) | Avg (sec) | Success | Count |
| neutron.create_network total | 0.165 0.166 | 0.197 0.197 | 0.277 0.277 | 0.295 0.295 | 0.462 0.462 | 0.211 0.211 | 100.0% 100.0% | 1000 1000 |
Rally report: rally_neutron_create_port.html
6.19.2.2. Create Neutron network with port
In this test case Rally creates Neutron network with one Neutron port at constant rate. The summary duration time is measured and dependency on number of requests per second is shown.
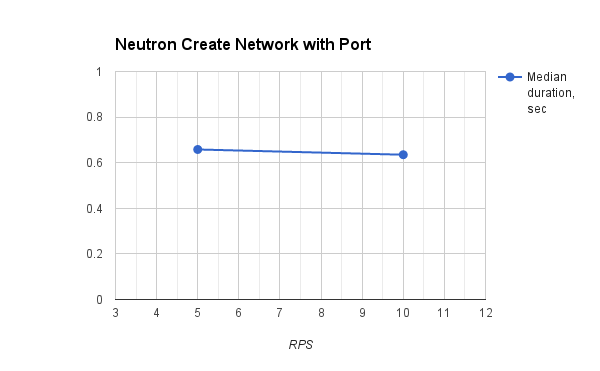
| RPS | Min (sec) | Median (sec) | Max (sec) | Avg (sec) |
|---|---|---|---|---|
| 5 | 0.505 | 0.658 | 4.712 | 0.795 |
| 10 | 0.468 | 0.635 | 2.789 | 0.712 |
Rally reports:
6.19.2.3. Create and list Neutron ports
In this test case Rally creates Neutron network with 20 ports and lists them. Operations are requested at constant rate. Achieved maximum rate: 0.1 RPS.
| Response Times (sec) | ||||||||
| Action | Min (sec) | Median (sec) | 90%ile (sec) | 95%ile (sec) | Max (sec) | Avg (sec) | Success | Count |
| neutron.create_port neutron.list_ports neutron.create_network total | 0.257 0.045 0.221 8.243 | 0.370 0.108 0.311 9.487 | 0.994 0.222 0.418 10.213 | 1.405 0.236 0.44 10.686 | 1.81 0.256 0.525 12.259 | 0.452 0.129 0.312 9.485 | 100.0% 100.0% 100.0% 100.0% | 50 50 50 50 |
Rally report: rally_neutron_create_port.html
6.19.2.4. Create Cinder volumes
The following chart and table show how operation duration depends on number of requests per second. The median grows, at 8 RPS one of request falls out of 1 minute.
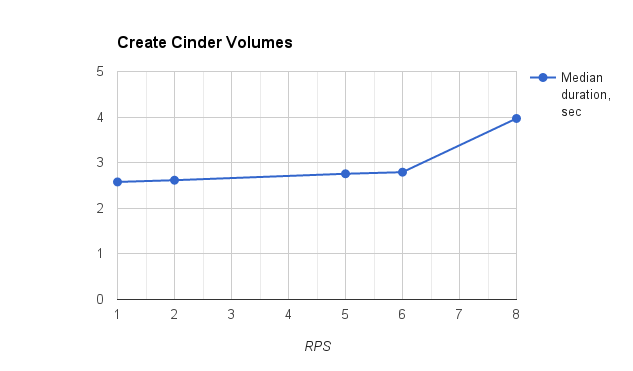
| RPS | Min (sec) | Median (sec) | Max (sec) | Avg (sec) |
|---|---|---|---|---|
| 1 | 2.462 | 2.578 | 3.158 | 2.607 |
| 2 | 2.474 | 2.616 | 3.029 | 2.644 |
| 5 | 2.52 | 2.757 | 7.701 | 2.788 |
| 6 | 2.565 | 2.792 | 3.975 | 2.83 |
| 8 | 2.654 | 3.97 | 73.869 | 16.608 |
Rally reports:
6.19.2.5. Boot Nova Server
The following chart and table show how operation duration depends on number of requests per second. Success rate falls beyond 100% as some of operations take longer than the timeout limit.
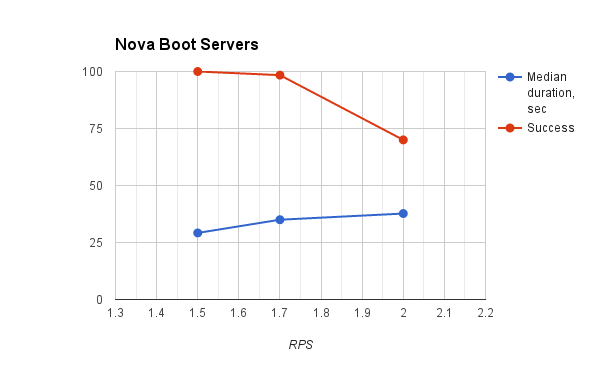
| RPS | Min (sec) | Median (sec) | Max (sec) | Avg (sec) | Success (%) |
|---|---|---|---|---|---|
| 1.5 | 12.234 | 29.197 | 118.353 | 34.074 | 100 |
| 1.7 | 12.626 | 34.993 | 182.083 | 48.736 | 98.4 |
| 2 | 13.426 | 37.698 | 298.564 | 50.021 | 70 |
Rally reports: