System Architecture
High-Level Architecture
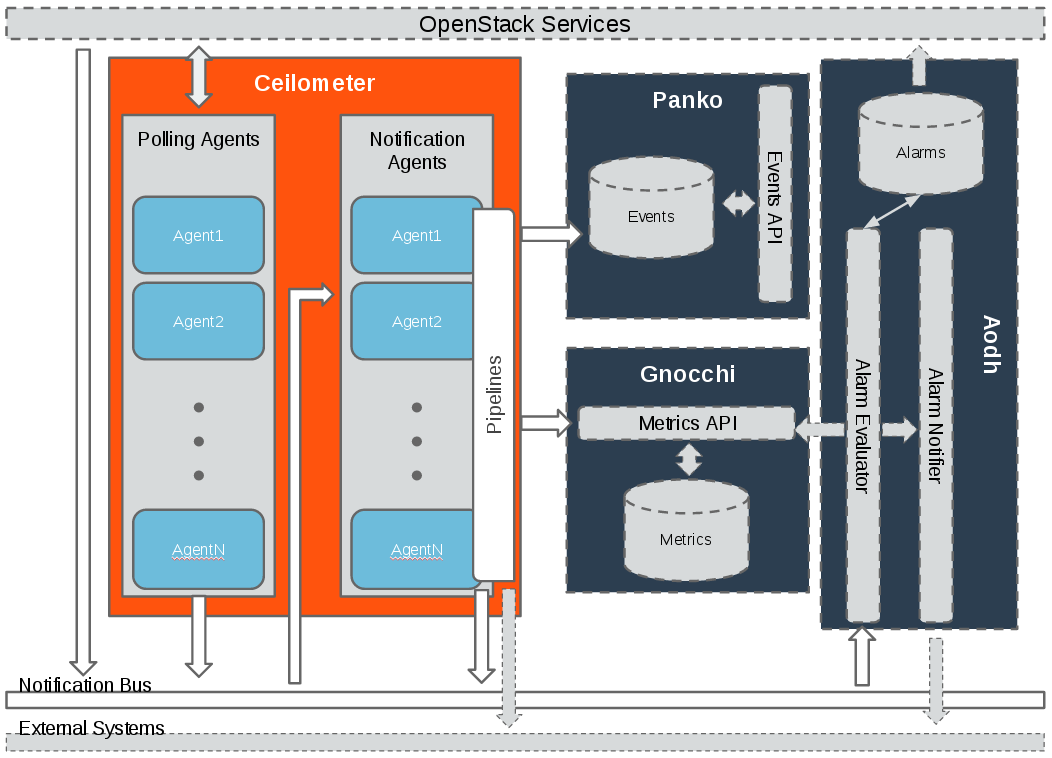
An overall summary of Ceilometer’s logical architecture.
Each of Ceilometer’s services are designed to scale horizontally. Additional workers and nodes can be added depending on the expected load. Ceilometer offers two core services:
polling agent - daemon designed to poll OpenStack services and build Meters.
notification agent - daemon designed to listen to notifications on message queue, convert them to Events and Samples, and apply pipeline actions.
Data normalised and collected by Ceilometer can be sent to various targets. Gnocchi was developed to capture measurement data in a time series format to optimise storage and querying. Gnocchi is intended to replace the existing metering database interface. Additionally, Aodh is the alarming service which can send alerts when user defined rules are broken. Lastly, Panko is the event storage project designed to capture document-oriented data such as logs and system event actions.
Gathering the data
How is data collected?
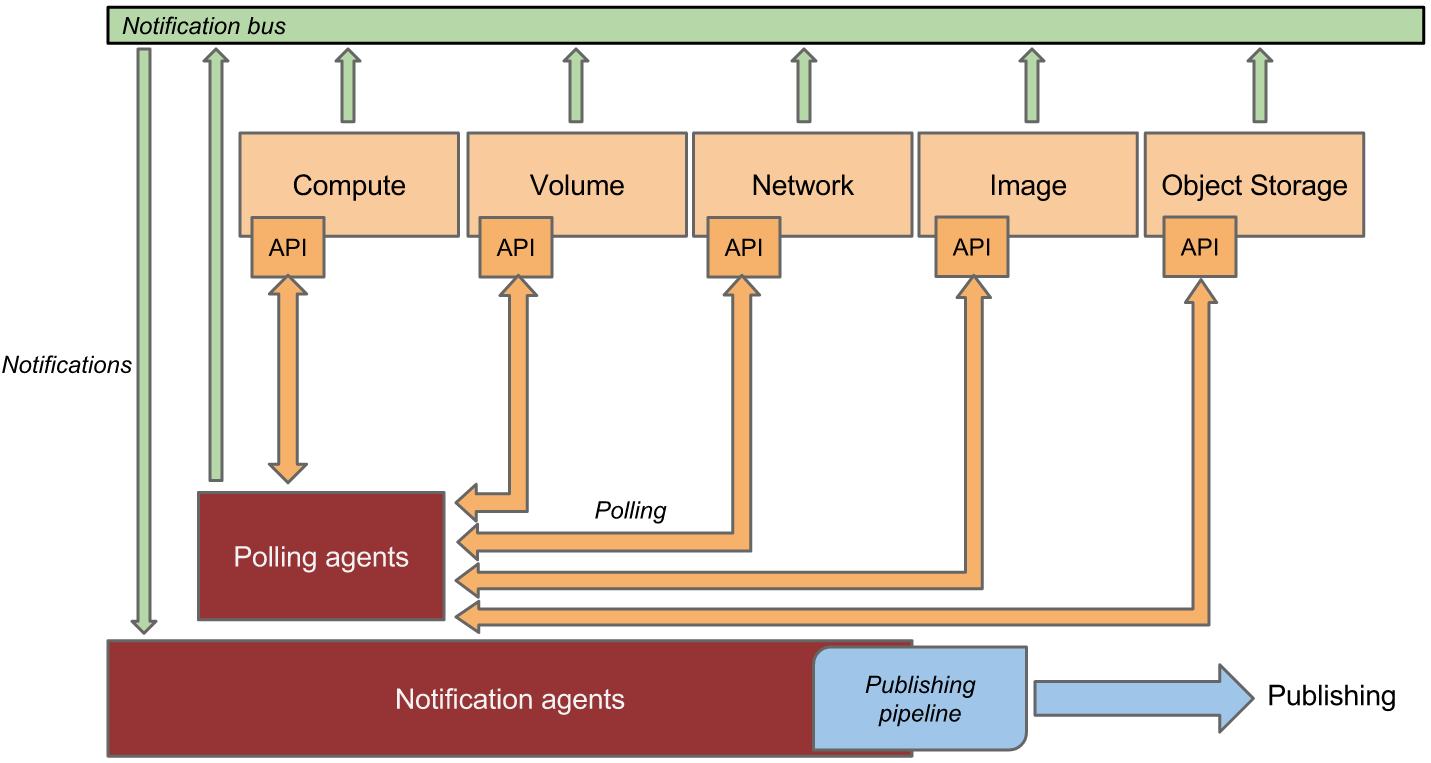
This is a representation of how the agents gather data from multiple sources.
The Ceilometer project created 2 methods to collect data:
notification agent which takes messages generated on the notification bus and transforms them into Ceilometer samples or events.
polling agent, will poll some API or other tool to collect information at a regular interval. The polling approach may impose significant on the API services so should only be used on optimised endpoints.
The first method is supported by the ceilometer-notification agent, which monitors the message queues for notifications. Polling agents can be configured either to poll the local hypervisor or remote APIs (public REST APIs exposed by services and host-level IPMI daemons).
Notification Agent: Listening for data
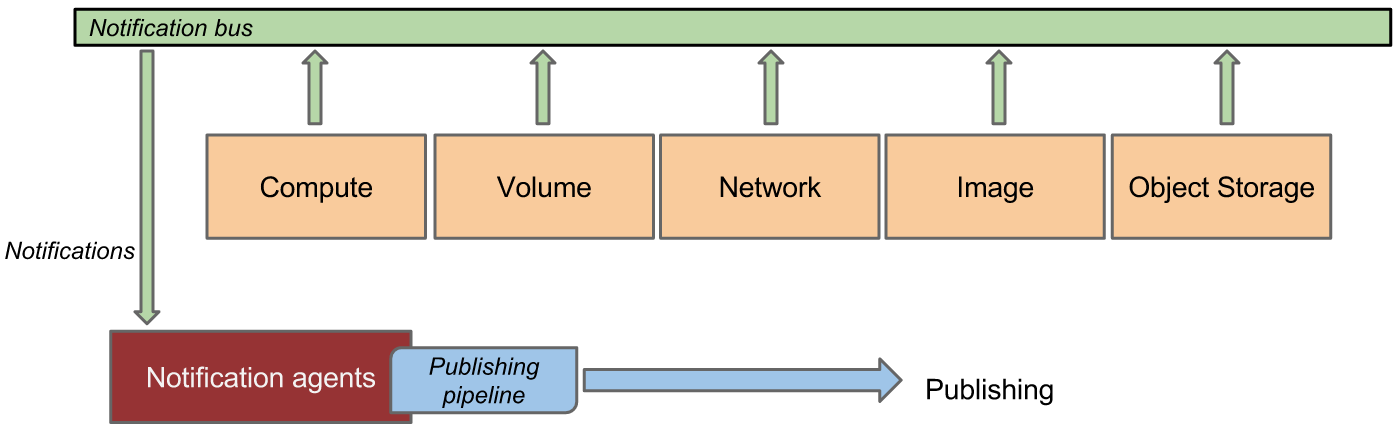
Notification agent consuming messages from services.
The heart of the system is the notification daemon (agent-notification) which monitors the message queue for data sent by other OpenStack components such as Nova, Glance, Cinder, Neutron, Swift, Keystone, and Heat, as well as Ceilometer internal communication.
The notification daemon loads one or more listener plugins, using the
namespace ceilometer.notification. Each plugin can listen to any topic,
but by default, will listen to notifications.info,
notifications.sample, and notifications.error. The listeners grab
messages off the configured topics and redistributes them to the appropriate
plugins(endpoints) to be processed into Events and Samples.
Sample-oriented plugins provide a method to list the event types they’re interested in and a callback for processing messages accordingly. The registered name of the callback is used to enable or disable it using the pipeline of the notification daemon. The incoming messages are filtered based on their event type value before being passed to the callback so the plugin only receives events it has expressed an interest in seeing.
Polling Agent: Asking for data
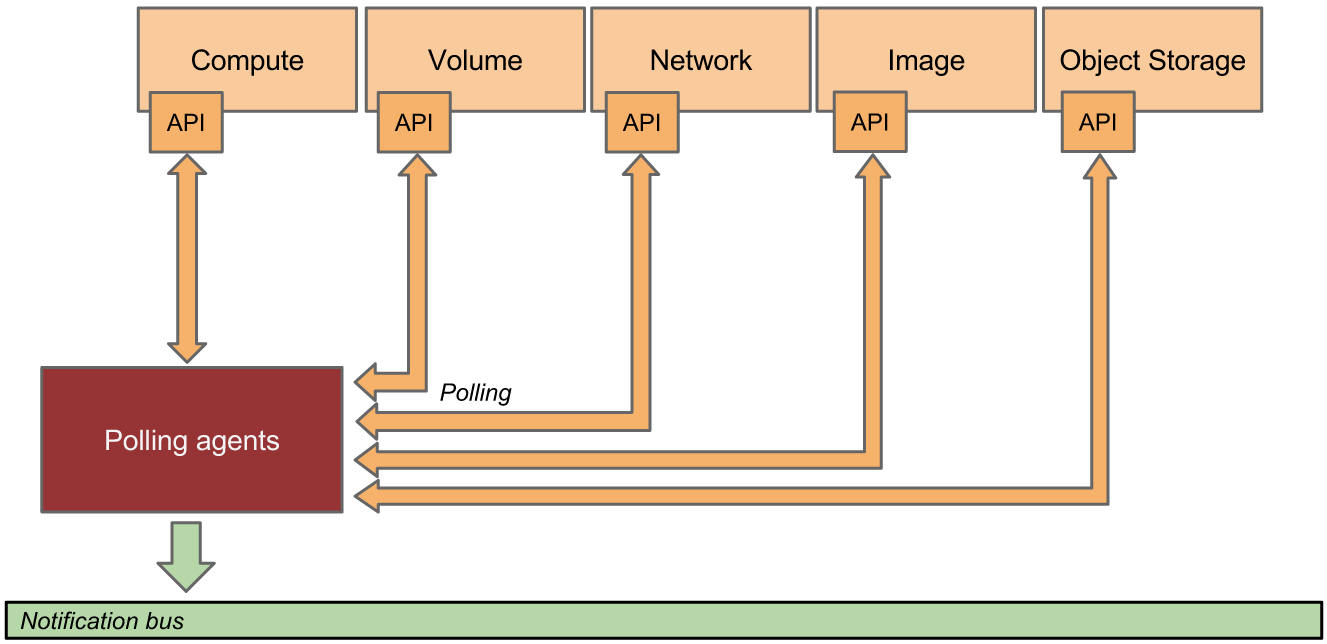
Polling agent querying services for data.
Polling for compute resources is handled by a polling agent running
on the compute node (where communication with the hypervisor is more
efficient), often referred to as the compute-agent. Polling via
service APIs for non-compute resources is handled by an agent running
on a cloud controller node, often referred to the central-agent.
A single agent can fulfill both roles in an all-in-one deployment.
Conversely, multiple instances of an agent may be deployed, in
which case the workload is shared. The polling agent
daemon is configured to run one or more pollster plugins using any
combination of ceilometer.poll.compute, ceilometer.poll.central, and
ceilometer.poll.ipmi namespaces
The frequency of polling is controlled via the polling configuration. See Polling for details. The agent framework then passes the generated samples to the notification agent for processing.
Processing the data
Pipeline Manager
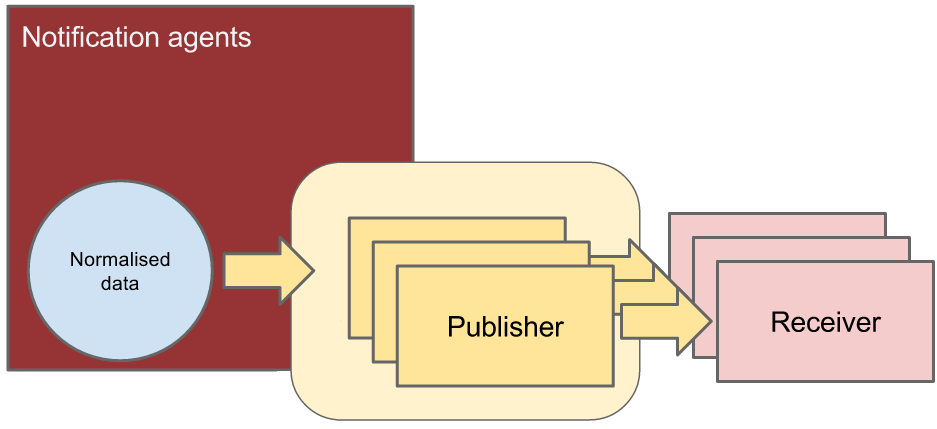
The assembly of components making the Ceilometer pipeline.
Ceilometer offers the ability to take data gathered by the agents, manipulate it, and publish it in various combinations via multiple pipelines. This functionality is handled by the notification agents.
Publishing the data
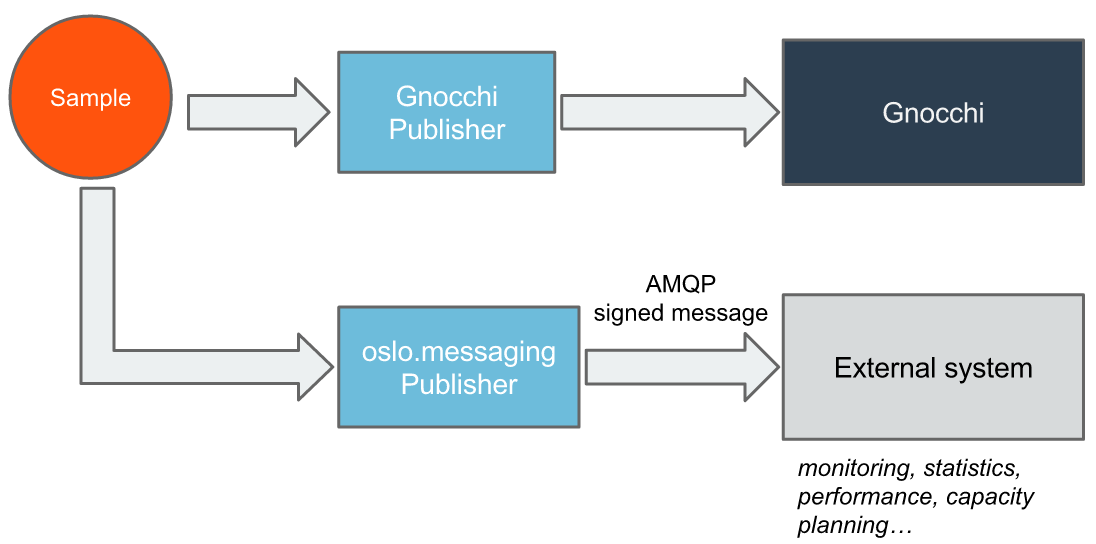
This figure shows how a sample can be published to multiple destinations.
Currently, processed data can be published using different transport options:
gnocchi, which publishes samples/events to Gnocchi API;
notifier, a notification based publisher which pushes samples to a message queue which can be consumed by an external system;
udp, which publishes samples using UDP packets;
http, which targets a REST interface;
file, which publishes samples to a file with specified name and location;
zaqar, a multi-tenant cloud messaging and notification service for web and mobile developers;
https, which is http over SSL and targets a REST interface;
prometheus, which publishes samples to Prometheus Pushgateway;
Storing/Accessing the data
Ceilometer is designed solely to generate and normalise cloud data. The data created by Ceilometer can be pushed to any number of target using publishers mentioned in pipeline-publishers section. The recommended workflow is to push data to Gnocchi for efficient time-series storage and resource lifecycle tracking.
