3.4. HA InfluxDB as an external storage for Prometheus
| Abstract: | This document describes a way to provide high-available InfluxDB storage based on Influx-relay and Nginx. |
|---|
3.4.1. Prometheus storage issue and solutions
Prometheus native storage was designed only for short period data and needs to be shortened in order to stay responsible and operational. For us to store persistent data for longer periods the ‘external storage’ mechanism was used. In this mode Prometheus duplicating its own data to external storage, only external writes are available. Several options were possible but we chose InfluxDB high-available solution. InfluxDB is a reliable and robust storage with many features. Also, it’s perfect in supplying monitoring data to Grafana dashboard.
| Software | Version |
| Prometheus | 1.4.0 |
| Grafana | 4.0.1 |
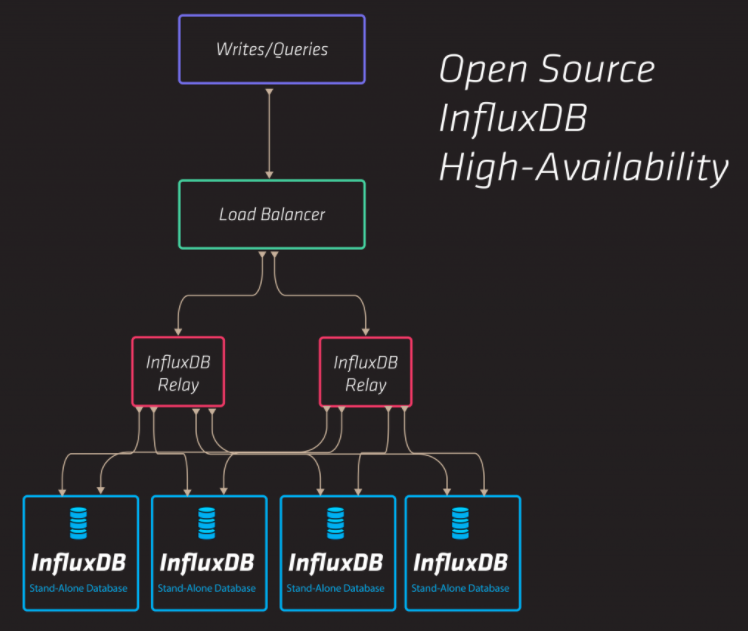
3.4.2. InfluxDB installation overview
During our deployment we were following Influx-Relay Offical Documentation. The installation comprises three nodes:
- first and second are InfluxDB instances with running Influx-relay daemon
- third is a load-balancer node with running Nginx
Influx-Relay working scheme taken from InfluxDB web site describes 5-nodes installation (four InfluxDB instances + Loadbalancer node), but three nodes were sufficient for our working load.
Ubuntu Xenial were used on each node. See software version table below:
| Software | Version |
| Ubuntu | Ubuntu 16.04.1 LTS |
| Kernel | 4.4.0-47-generic |
| InfluxDB | 1.2.0-17 |
| Influx-Relay | adaa2ea7bf97af592884fcfa57df1a2a77adb571 |
| Nginx | nginx/1.10.0 (Ubuntu) |
In order to deploy InfluxDB HA deployment InfluxdbHA deployment script was used.
3.4.3. InfluxDB HA mechanism realization
Native HA mechanisms were moved away from InfluxDB (since version 1.x.x) and now provided only as an enterprise option. Open-source third-party software Influx-relay is considered as one of the available substitutions for previous native replication mechanisms.
3.4.3.1. Influx-Relay
Influx-relay is written in Golang and its operation boils down to proxying incoming write queries to multiple destinations (InfluxDB instances). Influx-Relay runs on every InfluxDB node, thus any writes requests coming to any InfluxDB instance are mirrored across all other nodes. Influx-Relay is light and robust and it doesn’t consume much of the system resources. See Influx-Relay configuration in the Influx-Relay configuration section.
3.4.3.2. Nginx
Nginx daemon runs on a separate node and acts as load-balancer (upstream proxy mode). It redirects ‘/query’ queries directly to an each InfluxDB instance and ‘/write’ queries to an each Influx-relay daemon. Round-robin algorithm is scheduled for both query and write. This way, incoming reads and writes are balanced equally across the whole InfluxDB cluster. See Nginx configuration in the Nginx configuration section.
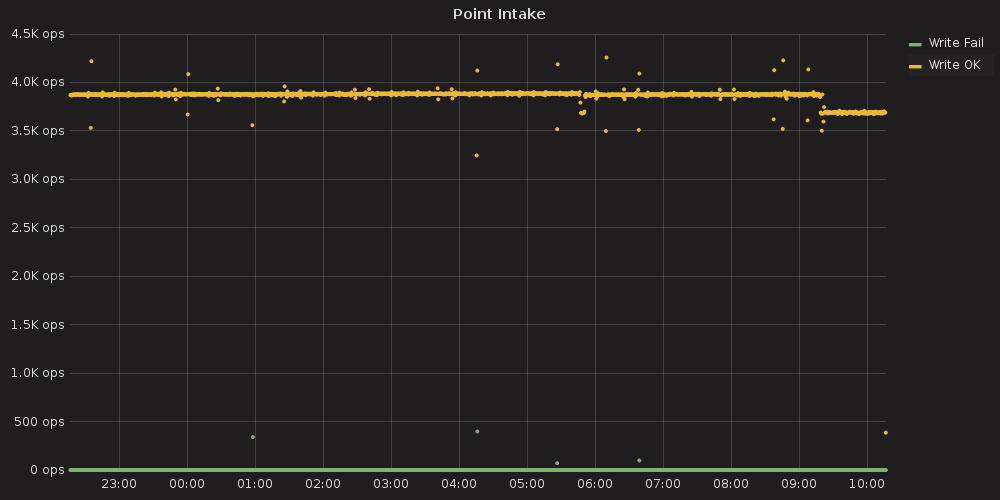
3.4.4. InfluxDB Monitoring
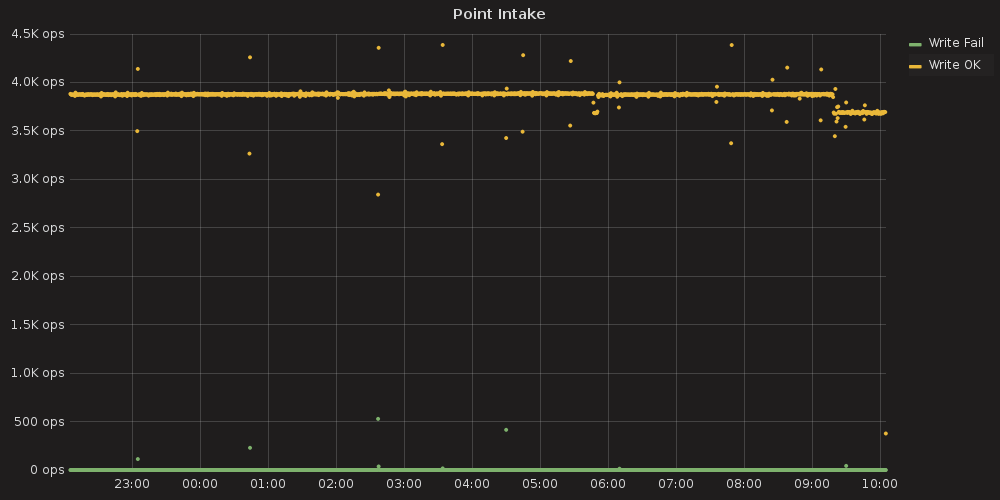
InfluxDB HA installation was tested with Prometheus that polls 200-nodes environment and generates huge data flows towards its external storage. In order to test InfluxDB performance ‘_internal’ database counters were used and visualized with the help of Grafana. We figured out that 3-nodes InfluxDB HA installation can handle 200-nodes Prometheus load and total performance doesn’t degrade. Grafana dashboards for InfluxDB monitoring can be found at Grafana InfluxDB dashboard section.
3.4.5. InfluxDB HA performance data
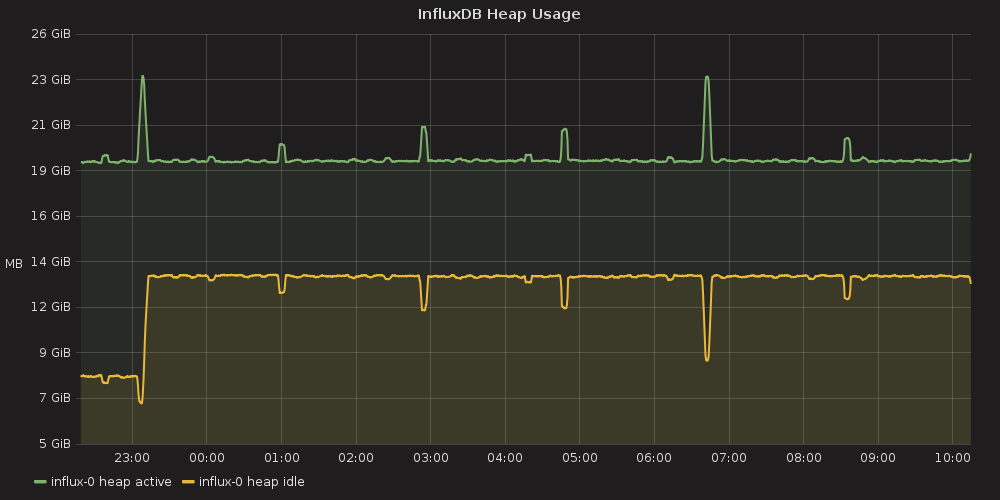
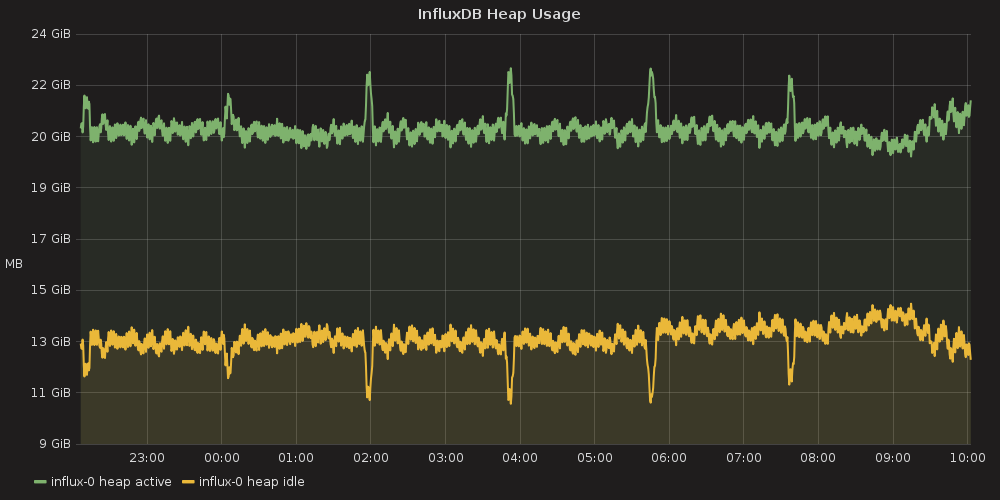
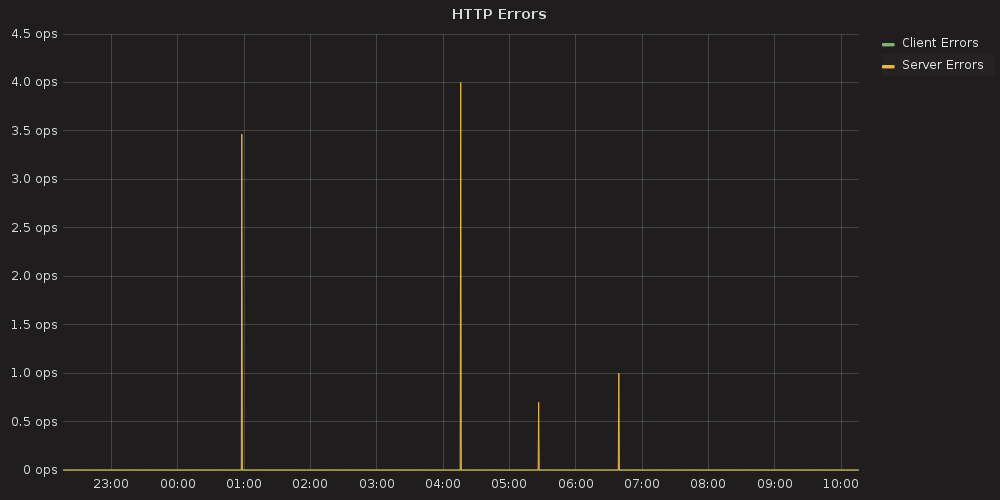
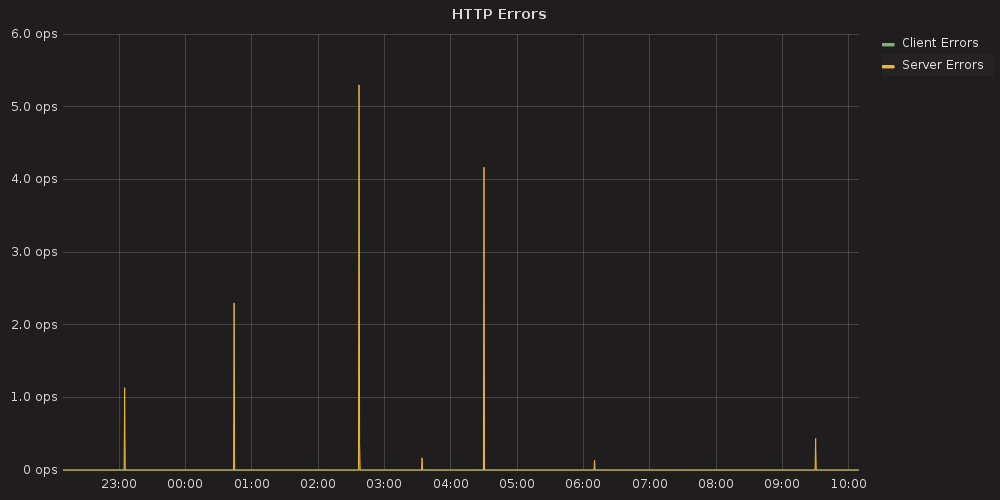
3.4.5.1. InfluxDB database performance data
These graphs were built with Grafana based on the metrics that are natively stored inside the InfluxDB ‘_internal’ database. To create the visualization we used Grafana InfluxDB dashboard.
| InfluxDB node1 database performance | InfluxDB node2 database performance |
|---|---|
|
|
|
|
|
|
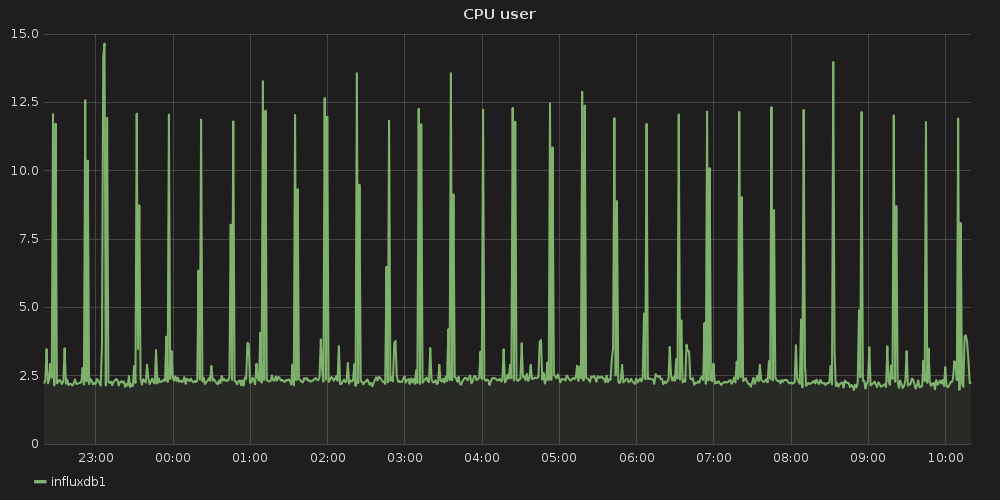
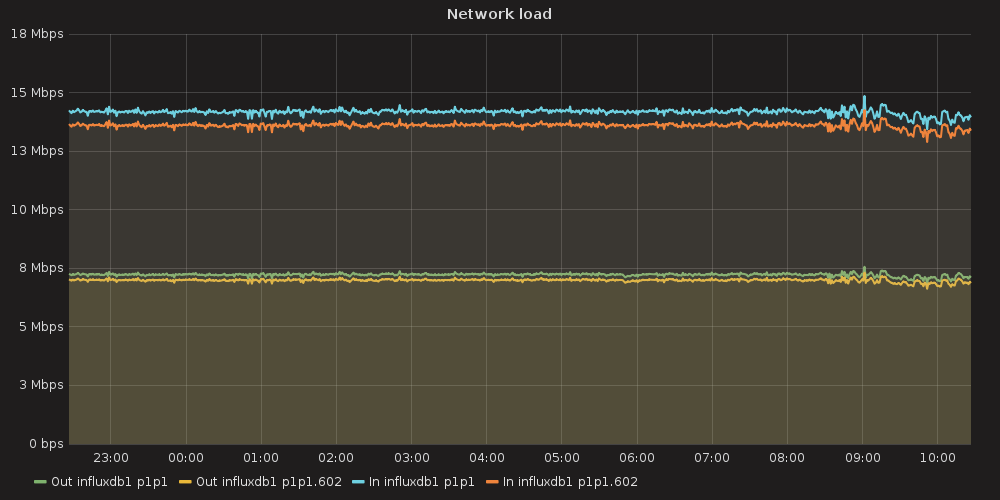
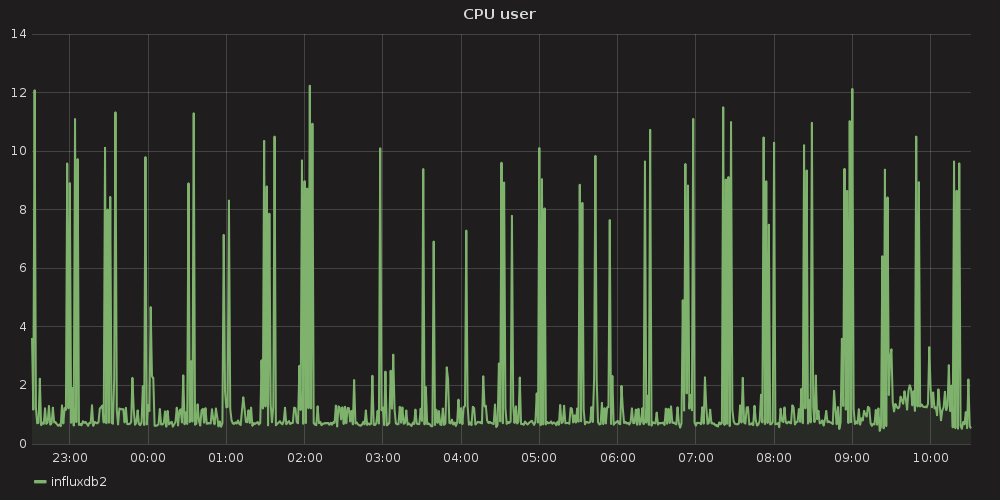
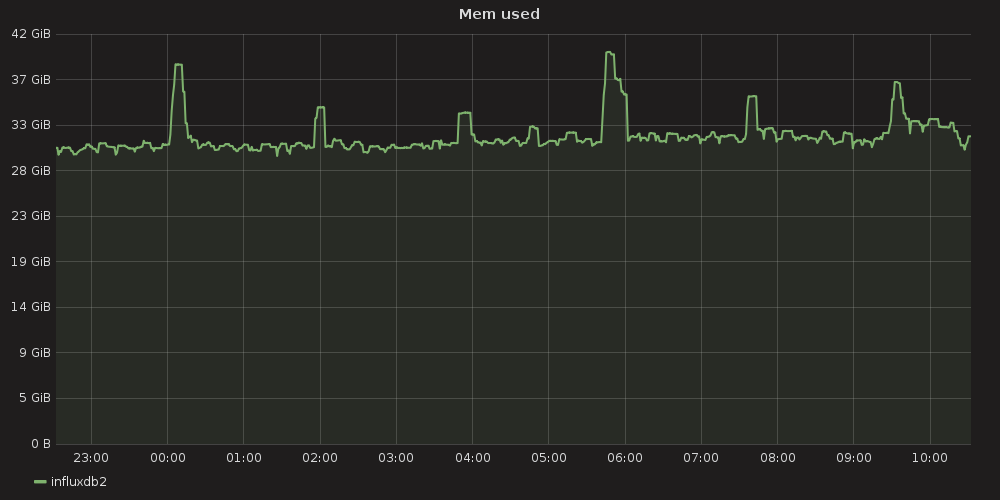
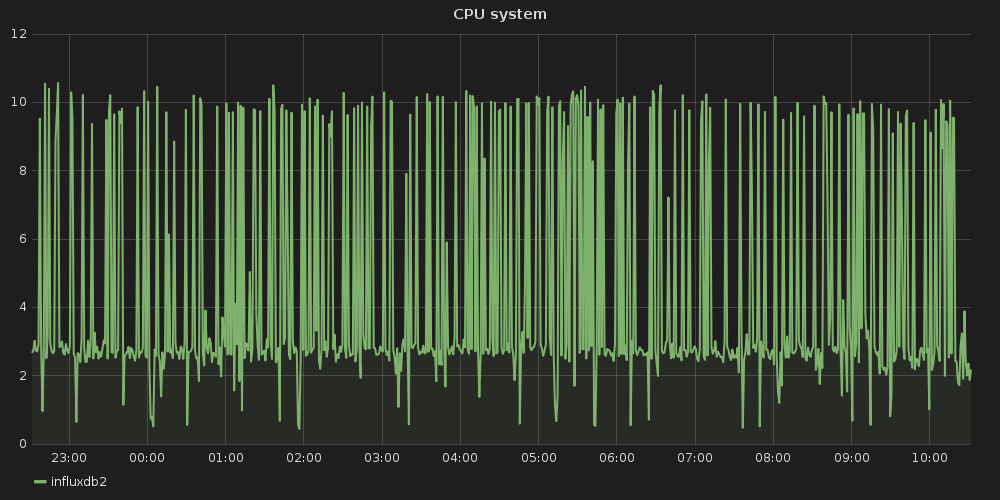
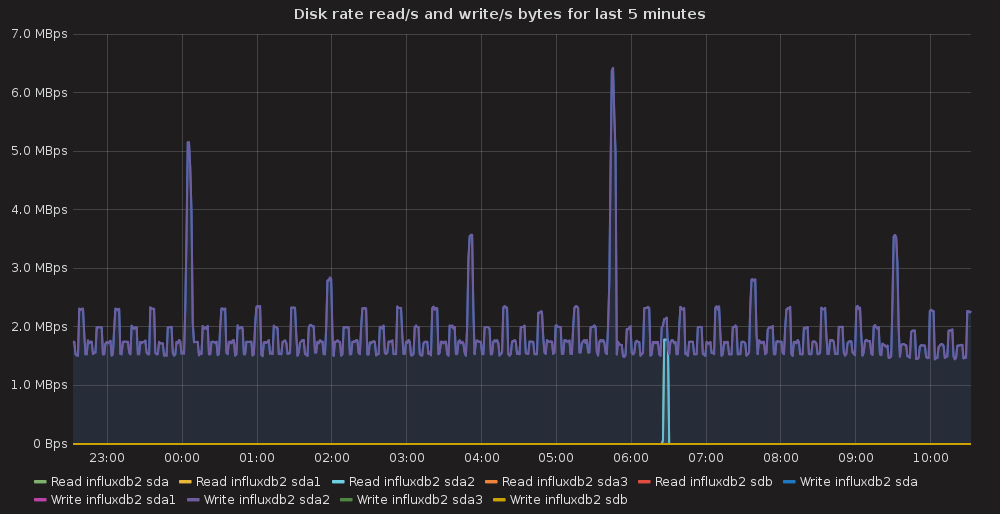
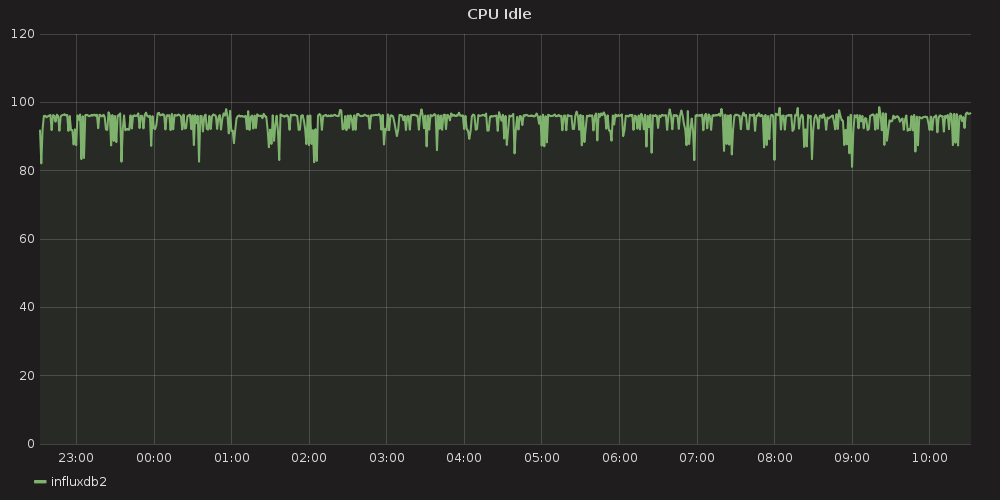
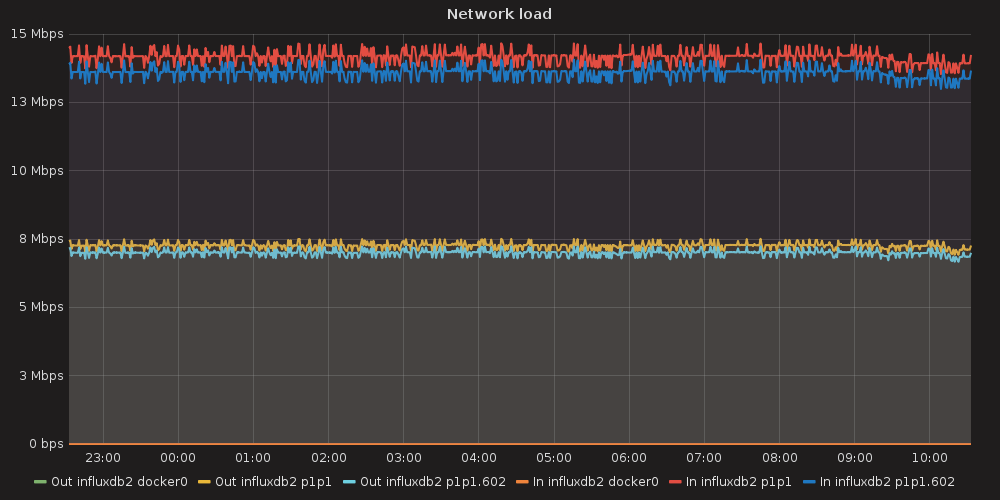
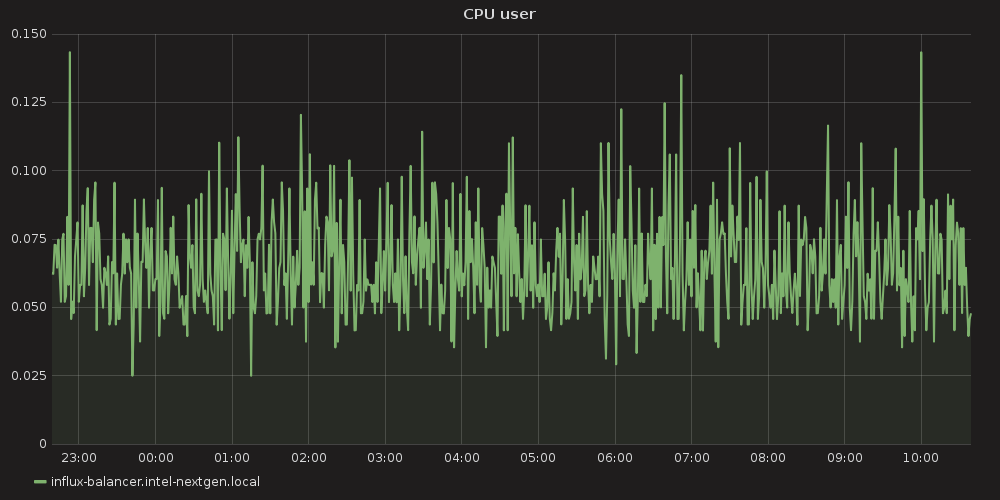
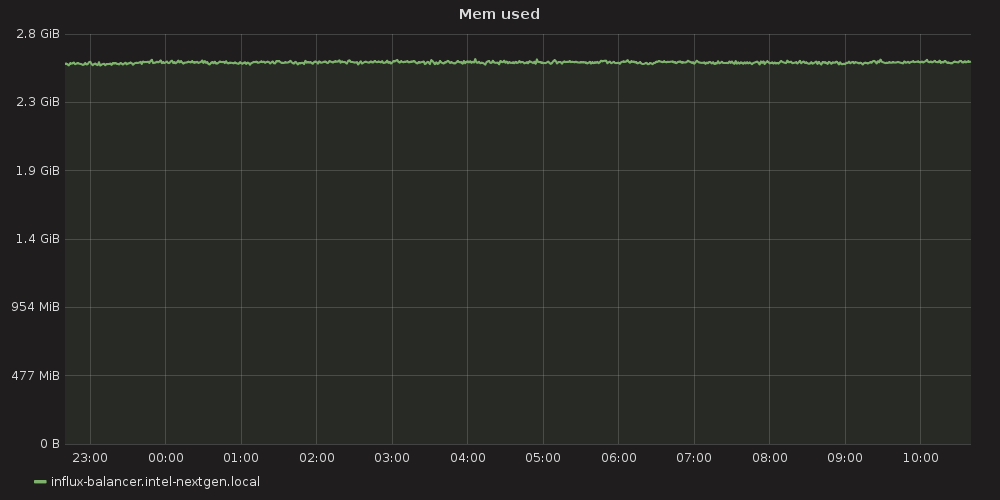
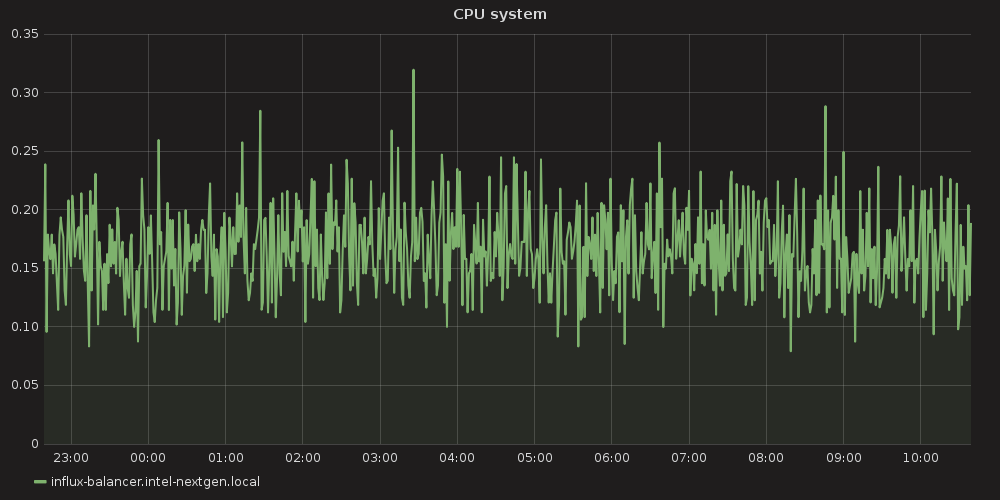
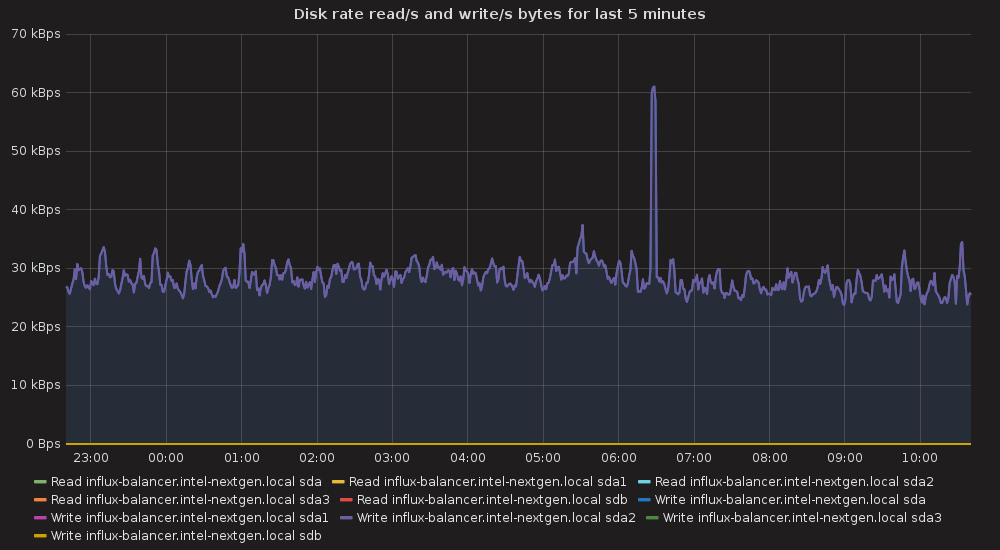
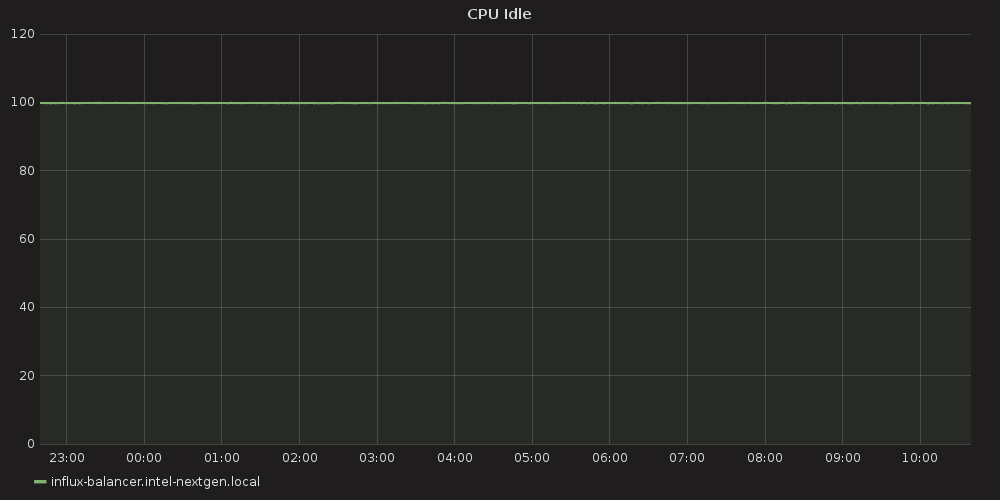
3.4.5.2. OS performance data
Operation System performance metrics were gathered using Telegraf agent that was started on each cluster node with appropriate plugins. See the Telegraf system configuration file from Containerized Openstack Monitoring documentation.
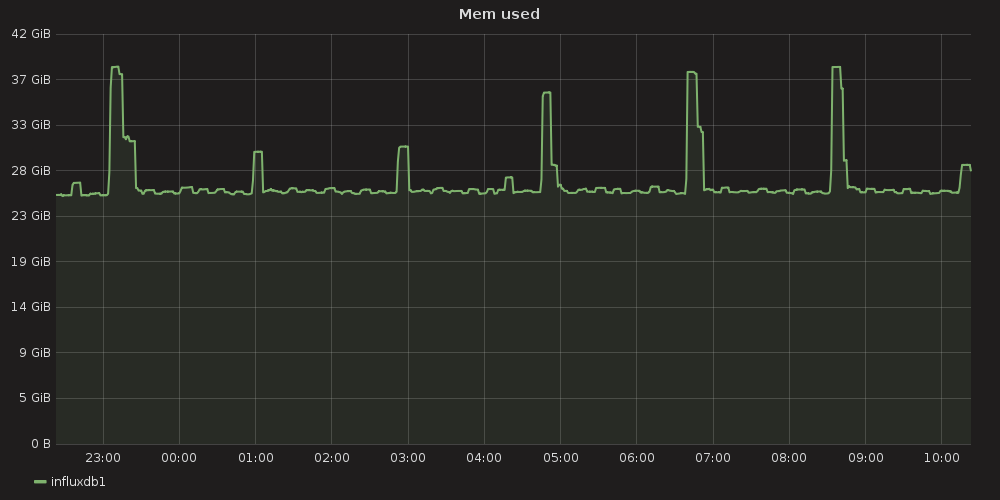
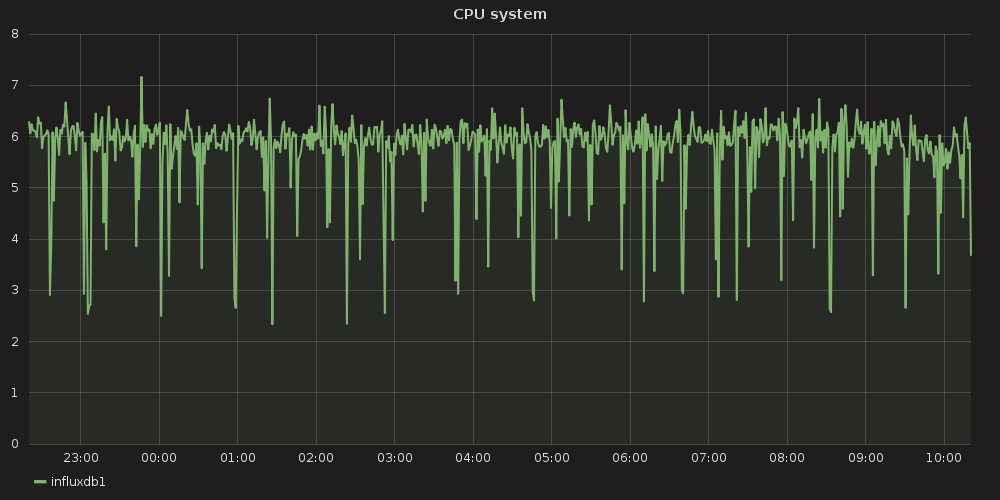
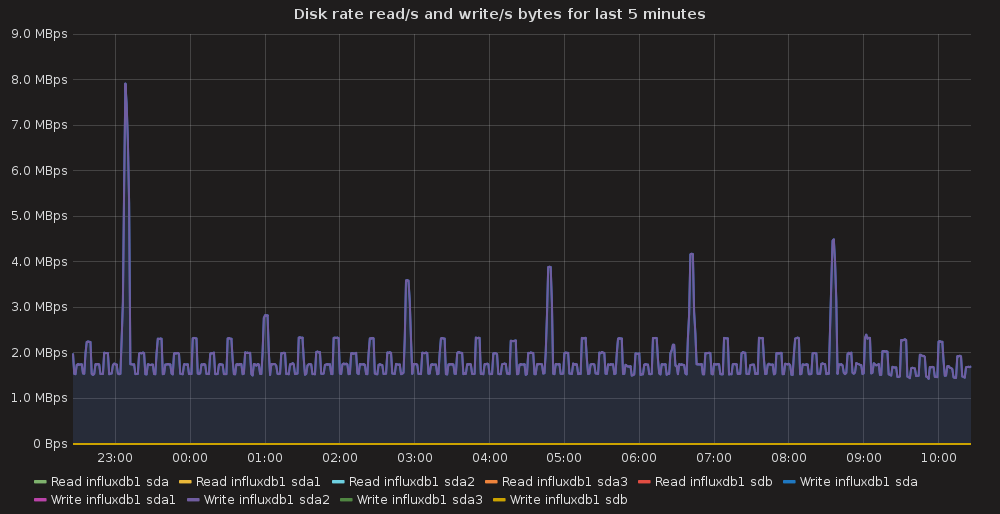
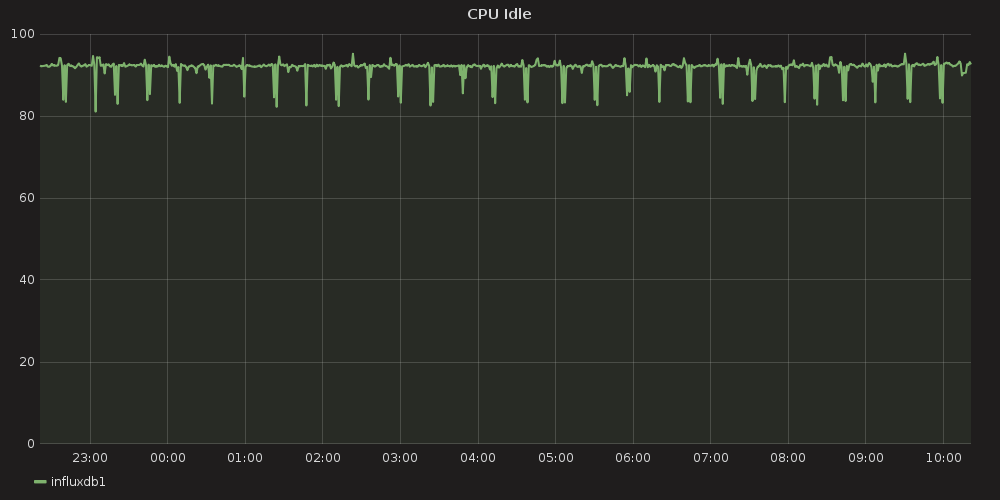
3.4.5.2.1. InfluxDB node1 OS performance
|
|
|
|
|
|
3.4.5.2.2. InfluxDB node2 OS performance
|
|
|
|
|
|
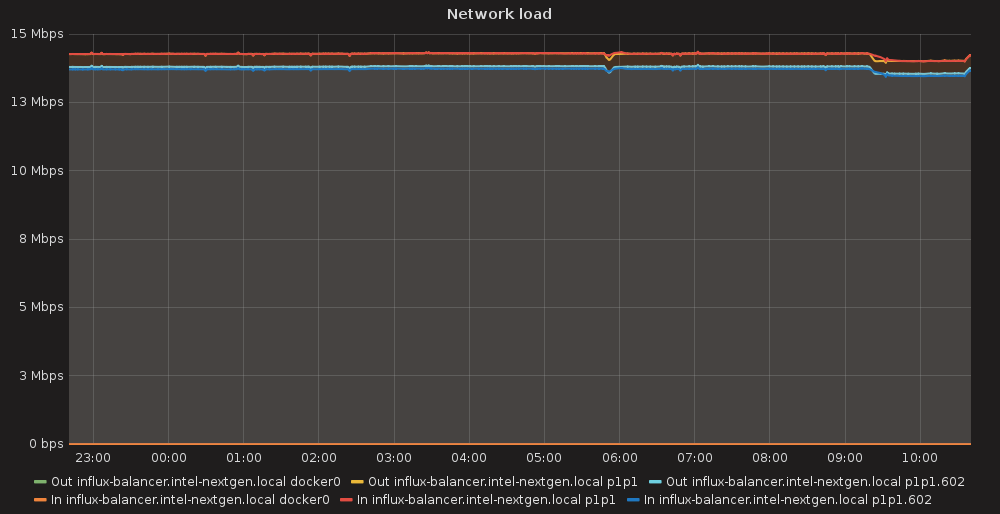
3.4.5.2.3. Load-balancer node OS performance
|
|
|
|
|
|
3.4.6. How to deploy
- Prepare three Ubuntu Xenial nodes with working network and Internet access
- Temporarily allow ssh access for root user
- Untar influx_ha_deployment.tar
- Set appropriate SSH_PASSWORD variable in the influx_ha/deploy_influx_ha.sh
- Start deployment script preceding it with node ip variables, e.g.
INFLUX1=172.20.9.29 INFLUX2=172.20.9.19 BALANCER=172.20.9.27 bash -xe influx_ha/deploy_influx_ha.sh
3.4.7. Applications
3.4.7.1. InfluxdbHA deployment script
#!/bin/bash -xe

INFLUX1=${INFLUX1:-172.20.9.29}
INFLUX2=${INFLUX2:-172.20.9.19}
BALANCER=${BALANCER:-172.20.9.27}
SSH_PASSWORD="r00tme"
SSH_USER="root"
SSH_OPTIONS="-o StrictHostKeyChecking=no -o UserKnownHostsFile=/dev/null"

type sshpass || (echo "sshpass is not installed" && exit 1)

ssh_exec() {
    node=$1
    shift
    sshpass -p ${SSH_PASSWORD} ssh ${SSH_OPTIONS} ${SSH_USER}@${node} "$@"
}

scp_exec() {
    node=$1
    src=$2
    dst=$3
    sshpass -p ${SSH_PASSWORD} scp ${SSH_OPTIONS} ${2} ${SSH_USER}@${node}:${3}
}

# prepare influx1:
ssh_exec $INFLUX1 "echo 'deb https://repos.influxdata.com/ubuntu xenial stable' > /etc/apt/sources.list.d/influxdb.list"
ssh_exec $INFLUX1 "apt-get update && apt-get install -y influxdb"
scp_exec $INFLUX1 conf/influxdb.conf /etc/influxdb/influxdb.conf
ssh_exec $INFLUX1 "service influxdb restart"
ssh_exec $INFLUX1 "echo 'GOPATH=/root/gocode' >> /etc/environment"
ssh_exec $INFLUX1 "apt-get install -y golang-go && mkdir /root/gocode"
ssh_exec $INFLUX1 "source /etc/environment && go get -u github.com/influxdata/influxdb-relay"
scp_exec $INFLUX1 conf/relay_1.toml /root/relay.toml
ssh_exec $INFLUX1 "sed -i -e 's/influx1_ip/${INFLUX1}/g' -e 's/influx2_ip/${INFLUX2}/g' /root/relay.toml"
ssh_exec $INFLUX1 "influxdb-relay -config  relay.toml &"

# prepare influx2:
ssh_exec $INFLUX2 "echo 'deb https://repos.influxdata.com/ubuntu xenial stable' > /etc/apt/sources.list.d/influxdb.list"
ssh_exec $INFLUX2 "apt-get update && apt-get install -y influxdb"
scp_exec $INFLUX2 conf/influxdb.conf /etc/influxdb/influxdb.conf
ssh_exec $INFLUX2 "service influxdb restart"
ssh_exec $INFLUX2 "echo 'GOPATH=/root/gocode' >> /etc/environment"
ssh_exec $INFLUX2 "apt-get install -y golang-go && mkdir /root/gocode"
ssh_exec $INFLUX2 "source /etc/environment && go get -u github.com/influxdata/influxdb-relay"
scp_exec $INFLUX2 conf/relay_2.toml /root/relay.toml
ssh_exec $INFLUX2 "sed -i -e 's/influx1_ip/${INFLUX1}/g' -e 's/influx2_ip/${INFLUX2}/g' /root/relay.toml"
ssh_exec $INFLUX2 "influxdb-relay -config  relay.toml &"

# prepare balancer:
ssh_exec $BALANCER "apt-get install -y nginx"
scp_exec $BALANCER conf/influx-loadbalancer.conf /etc/nginx/sites-enabled/influx-loadbalancer.conf
ssh_exec $BALANCER "sed -i -e 's/influx1_ip/${INFLUX1}/g' -e 's/influx2_ip/${INFLUX2}/g' /etc/nginx/sites-enabled/influx-loadbalancer.conf"
ssh_exec $BALANCER "service nginx reload"

echo "INFLUX HA SERVICE IS AVAILABLE AT http://${BALANCER}:7076"
3.4.7.1.1. Configuration tarball (for deployment script)
3.4.7.2. InfluxDB configuration
reporting-disabled = false
bind-address = ":8088"

[meta]
  dir = "/var/lib/influxdb/meta"
  retention-autocreate = true
  logging-enabled = true

[data]
  dir = "/var/lib/influxdb/data"
  wal-dir = "/var/lib/influxdb/wal"
  query-log-enabled = true
  cache-max-memory-size = 1073741824
  cache-snapshot-memory-size = 26214400
  cache-snapshot-write-cold-duration = "10m0s"
  compact-full-write-cold-duration = "4h0m0s"
  max-series-per-database = 0
  max-values-per-tag = 100000
  trace-logging-enabled = false

[coordinator]
  write-timeout = "10s"
  max-concurrent-queries = 0
  query-timeout = "0s"
  log-queries-after = "0s"
  max-select-point = 0
  max-select-series = 0
  max-select-buckets = 0

[retention]
  enabled = true
  check-interval = "30m0s"

[shard-precreation]
  enabled = true
  check-interval = "10m0s"
  advance-period = "30m0s"

[admin]
  enabled = false
  bind-address = ":8083"
  https-enabled = false
  https-certificate = "/etc/ssl/influxdb.pem"

[monitor]
  store-enabled = true
  store-database = "_internal"
  store-interval = "10s"

[subscriber]
  enabled = true
  http-timeout = "30s"
  insecure-skip-verify = false
  ca-certs = ""
  write-concurrency = 40
  write-buffer-size = 1000

[http]
  enabled = true
  bind-address = ":8086"
  auth-enabled = false
  log-enabled = true
  write-tracing = false
  pprof-enabled = true
  https-enabled = false
  https-certificate = "/etc/ssl/influxdb.pem"
  https-private-key = ""
  max-row-limit = 10000
  max-connection-limit = 0
  shared-secret = ""
  realm = "InfluxDB"
  unix-socket-enabled = false
  bind-socket = "/var/run/influxdb.sock"

[[graphite]]
  enabled = false
  bind-address = ":2003"
  database = "graphite"
  retention-policy = ""
  protocol = "tcp"
  batch-size = 5000
  batch-pending = 10
  batch-timeout = "1s"
  consistency-level = "one"
  separator = "."
  udp-read-buffer = 0

[[collectd]]
  enabled = false
  bind-address = ":25826"
  database = "collectd"
  retention-policy = ""
  batch-size = 5000
  batch-pending = 10
  batch-timeout = "10s"
  read-buffer = 0
  typesdb = "/usr/share/collectd/types.db"
  security-level = "none"
  auth-file = "/etc/collectd/auth_file"

[[opentsdb]]
  enabled = false
  bind-address = ":4242"
  database = "opentsdb"
  retention-policy = ""
  consistency-level = "one"
  tls-enabled = false
  certificate = "/etc/ssl/influxdb.pem"
  batch-size = 1000
  batch-pending = 5
  batch-timeout = "1s"
  log-point-errors = true

[[udp]]
  enabled = false
  bind-address = ":8089"
  database = "udp"
  retention-policy = ""
  batch-size = 5000
  batch-pending = 10
  read-buffer = 0
  batch-timeout = "1s"
  precision = ""

[continuous_queries]
  log-enabled = true
  enabled = true
  run-interval = "1s"
3.4.7.3. Influx-Relay configuration
3.4.7.3.1. first instance
# Name of the HTTP server, used for display purposes only
[[http]]
name = "influx-http"

# TCP address to bind to, for HTTP server
bind-addr = "influx1_ip:9096"

# Array of InfluxDB instances to use as backends for Relay
# name: name of the backend, used for display purposes only.
# location: full URL of the /write endpoint of the backend
# timeout: Go-parseable time duration. Fail writes if incomplete in this time.
# skip-tls-verification: skip verification for HTTPS location. WARNING: it's insecure. Don't use in production.
output = [
    { name="local-influx1", location = "http://127.0.0.1:8086/write", timeout="10s"  },
    { name="remote-influx2", location = "http://influx2_ip:8086/write", timeout="10s"  },
]

[[udp]]
# Name of the UDP server, used for display purposes only
name = "influx-udp"

# UDP address to bind to
bind-addr = "127.0.0.1:9096"

# Socket buffer size for incoming connections
read-buffer = 0 # default

# Precision to use for timestamps
precision = "n" # Can be n, u, ms, s, m, h

# Array of InfluxDB UDP instances to use as backends for Relay
# name: name of the backend, used for display purposes only.
# location: host and port of backend.
# mtu: maximum output payload size
output = [
    { name="local-influx1-udp", location="127.0.0.1:8089", mtu=512 },
    { name="remote-influx2-udp", location="influx2_ip:8089", mtu=512 },
]
3.4.7.3.2. second instance
# Name of the HTTP server, used for display purposes only
[[http]]
name = "influx-http"

# TCP address to bind to, for HTTP server
bind-addr = "influx2_ip:9096"

# Array of InfluxDB instances to use as backends for Relay
# name: name of the backend, used for display purposes only.
# location: full URL of the /write endpoint of the backend
# timeout: Go-parseable time duration. Fail writes if incomplete in this time.
# skip-tls-verification: skip verification for HTTPS location. WARNING: it's insecure. Don't use in production.
output = [
    { name="local-influx2", location = "http://127.0.0.1:8086/write", timeout="10s"  },
    { name="remote-influx1", location = "http://influx1_ip:8086/write", timeout="10s"  },
]

[[udp]]
# Name of the UDP server, used for display purposes only
name = "influx-udp"

# UDP address to bind to
bind-addr = "127.0.0.1:9096"

# Socket buffer size for incoming connections
read-buffer = 0 # default

# Precision to use for timestamps
precision = "n" # Can be n, u, ms, s, m, h

# Array of InfluxDB UDP instances to use as backends for Relay
# name: name of the backend, used for display purposes only.
# location: host and port of backend.
# mtu: maximum output payload size
output = [
    { name="local-influx2-udp", location="127.0.0.1:8089", mtu=512 },
    { name="remote-influx1-udp", location="influx1_ip:8089", mtu=512 },
]
3.4.7.4. Nginx configuration
  client_max_body_size 20M;

  upstream influxdb {
    server influx1_ip:8086;
    server influx2_ip:8086;
  }
  upstream relay {
    server influx1_ip:9096;
    server influx2_ip:9096;
  }

  server {
    listen 7076;
    location /query {
      limit_except GET {
        deny all;
      }
      proxy_pass http://influxdb;
    }
    location /write {
      limit_except POST {
        deny all;
      }
      proxy_pass http://relay;
    }
  }


# stream {
#   upstream test {
#     server server1:8003;
#     server server2:8003;
#   }
#
#   server {
#     listen 7003 udp;
#     proxy_pass test;
#     proxy_timeout 1s;
#     proxy_responses 1;
#   }
# }