5.28.2. OpenStack reliability testing. Version 2.0
| status: | draft |
|---|---|
| version: | 2.0 |
| Abstract: | This test plan describes methodology for reliability testing of OpenStack. |
| Conventions: |
|
5.28.2.1. Test Plan
5.28.2.1.1. Test Environment
5.28.2.1.1.1. Preparation
This test plan is executed against existing OpenStack cloud.
- Measurements can be done with the tool that:
- is able to inject faults into existing OpenStack cloud at specified moment of execution;
- collects duration of single operations and errors;
- calculates metrics specified in the test plan (e.g. MTTR, Service Downtime).
5.28.2.1.1.2. Environment description
The environment description includes hardware specification of servers, network parameters, operation system and OpenStack deployment characteristics.
5.28.2.1.1.2.1. Hardware
This section contains list of all types of hardware nodes.
| Parameter | Value | Comments |
| model | e.g. Supermicro X9SRD-F | |
| CPU | e.g. 6 x Intel(R) Xeon(R) CPU E5-2620 v2 @ 2.10GHz | |
| role | e.g. compute or network |
5.28.2.1.1.2.2. Network
This section contains list of interfaces and network parameters. For complicated cases this section may include topology diagram and switch parameters.
| Parameter | Value | Comments |
| network role | e.g. provider or public | |
| card model | e.g. Intel | |
| driver | e.g. ixgbe | |
| speed | e.g. 10G or 1G | |
| MTU | e.g. 9000 | |
| offloading modes | e.g. default |
5.28.2.1.1.2.3. Software
This section describes installed software.
| Parameter | Value | Comments |
| OS | e.g. Ubuntu 14.04.3 | |
| OpenStack | e.g. Liberty | |
| Hypervisor | e.g. KVM | |
| Neutron plugin | e.g. ML2 + OVS | |
| L2 segmentation | e.g. VLAN or VxLAN or GRE | |
| virtual routers | e.g. legacy or HA or DVR |
5.28.2.1.2. Test Case: Reliability Metrics Calculation
5.28.2.1.2.1. Description
The test case is performed by running a specific OpenStack operation with injected fault. Every test is executed several times to collect more reliable statistical data.
5.28.2.1.2.2. Parameters
- The test case is configured with:
- OpenStack operation that is tested (e.g. network creation);
- fault that is injected into execution pipeline (e.g. service restart);
- Types of faults:
- Service-related:
- restart - service is stopped gracefully and then started;
- kill - service is terminated abruptly by OS;
- unplug/plug - service network partitioning.
- Node-related:
- reboot - node is rebooted gracefully;
- reset - cold restart of the node with potential data loss;
- poweroff/poweron - node is switched off and on;
- connect/disconnect - node’s network interface is flapped.
- Service-related:
5.28.2.1.2.3. List of performance metrics
A particular fault may affect operations in different ways. Operations may fail with error and we can count such errors and estimate how long the downtime was. Operations may degrade in performance and we can compare performance with base numbers. Also we can estimate time while the performance was degraded.
If both errors and performance degradation are observed the image could look like the following:
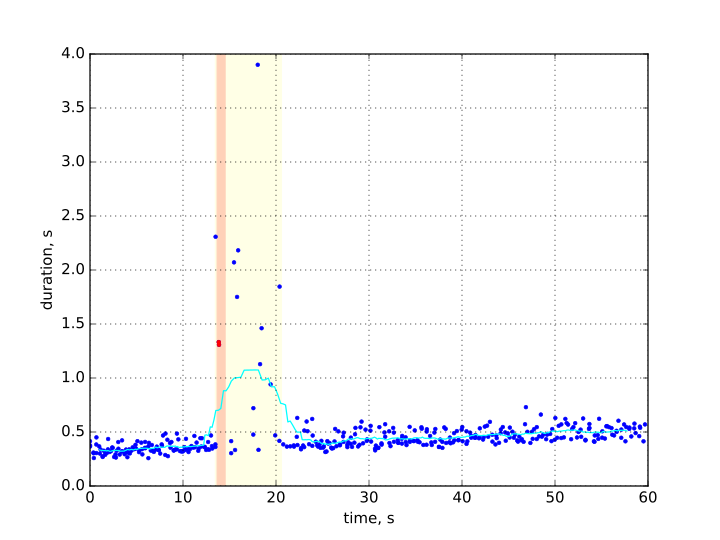
Here the light blue line shows the mean operation duration, orange area is where errors are observed and yellow where the performance is low.
Overall the following metrics need to be collected:
| Priority | Value | Measurement Unit | Description |
|---|---|---|---|
| 1 | Service downtime | sec | How long the service was not available and operations were in error state. |
| 1 | MTTR | sec | How long does it takes to recover service performance after the failure. |
| 1 | Absolute performance degradation | sec | the mean of difference in operation performance during recovery period and operation performance when service operates normally. |
| 1 | Relative performance degradation | ratio | the ratio between operation performance during recovery period and operation performance when service operates normally. |
The final report may also contain one or more charts that show operation behavior during the test.
5.28.2.2. Tools
5.28.2.2.1. Rally + os-faults
This test plan can be executed with Rally tool. Rally can report duration of individual operations and report errors. Rally Hooks features allows to call external code at specified moments of scenario execution.
os-faults library provides a generic way to inject faults into OpenStack cloud. It supports both service and node based operations.
The integration between Rally and os-faults is implemented as Rally hooks
plugin: fault_injection.py
5.28.2.2.1.1. Calculations
Metrics calculations are based on raw data collected from Rally (Rally json output). The raw data contains list of iterations with duration of each iteration. If some operation failed the iteration contains error field. Also raw data contains hook information, when it was started and its execution status.
The period of scenario execution before the hook is interpreted as the baseline. It is used to measure operation’s baseline mean and deviation.
Service downtime is calculated as time interval between the first and the last errors. The precision of calculation is average distance between the last succeed operation and the first error, and the last error and the next succeed operation.
To find the recovery period we first calculate the mean duration of consequent operations with sliding window. The period is treated as Recovery period when mean operation duration is significantly more than the mean operation duration in the baseline. The average duration of Recovery period is MTTR value. Absolute performance degradatio is calculated as difference between mean of operation duration during Recovery period and the baseline’s. Relative performance degradation is the ratio between mean of operation duration during Recovery period and the baseline’s.
5.28.2.2.1.2. How to run
- Prerequisites:
- Install Rally tool and configure deployment parameters
- Verify that Rally is properly installed by running
rally show flavors
- Verify that Rally is properly installed by running
- Install os-faults library:
pip install os-faults- Configure cloud and power management parameters, refer to os-faults-cfg
- Verify parameters by running
os-inject-fault -v
- Install RallyRunners tool:
pip install rally-runners
- Install Rally tool and configure deployment parameters
- Run scenarios:
rally-reliability -s SCENARIO -o OUTPUT -b BOOK- To show full list of scenarios:
rally-reliability -h
5.28.2.3. Reports
- Test plan execution reports: