4. Results of the ETCD health tests
| Abstract: | This piece of art includes the results of the ETCD tests made basing on the ETCD health research test plan. Our goal was to research how many Kubernetes items (pods and services) could be spawned in terms of ETCD. We figured out which ETCD metrics are crucial and collected them under appropriate (pods or services) load. Corresponding dependency plots were made based on this data. |
|---|
4.1. Environment description
4.1.1. Hardware configuration of each server
| server | name | node-{1..430} | node-{1..430} |
| role | kubernetes cluster | kubernetes cluster | |
| vendor,model | Dell, R630 | Lenovo, RD550-1U | |
| operating_system | 4.4.0-36-generic
Ubuntu-xenial
x86_64
|
4.4.0-36-generic
Ubuntu-xenial
x86_64
|
|
| CPU | vendor,model | Intel, E5-2680v3 | Intel, E5-2680 v3 |
| processor_count | 2 | 2 | |
| core_count | 12 | 12 | |
| frequency_MHz | 2500 | 2500 | |
| RAM | vendor,model | Hynix HMA42GR7MFR4N-TF | Samsung M393A2G40DB0-CPB |
| amount_MB | 262144 | 262144 | |
| NETWORK | interface_name | bond0 | bond0 |
| vendor,model | Intel, X710 Dual Port | Intel, X710 Dual Port | |
| interfaces_count | 2 | 2 | |
| bandwidth | 10G | 10G | |
| STORAGE | dev_name | /dev/sda | /dev/sda |
| vendor,model | raid1 PERC H730P Mini
2 disks Intel S3610
|
raid1 MegaRAID 3108
2 disks Intel S3610
|
|
| SSD/HDD | SSD | SSD | |
| size | 800GB | 800GB |
4.1.2. Network scheme and part of configuration of hardware network switches
Network scheme of the environment:
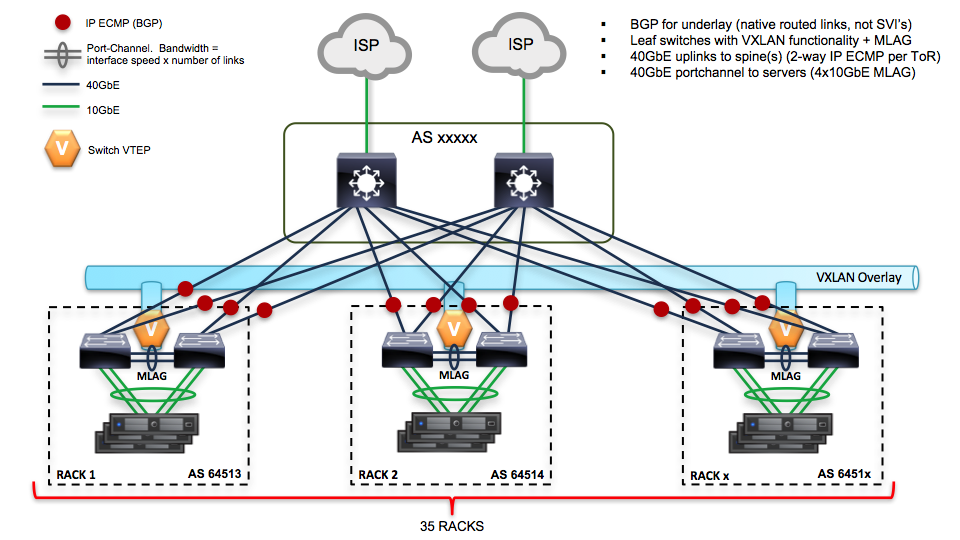
Here is the piece of switch configuration for each switch port which is a part of bond0 interface of a server:
show run int et1 interface Ethernet1
description - r02r13c33 switchport trunk native vlan 4 switchport trunk allowed vlan 4 switchport mode trunk channel-group 133 mode active lacp port-priority 16384 spanning-tree portfast
show run int po1 interface Port-Channel1
description osscr02r13c21 switchport trunk native vlan 131 switchport trunk allowed vlan 130-159 switchport mode trunk port-channel lacp fallback static port-channel lacp fallback timeout 30 mlag 1
4.1.3. Software configuration
4.1.3.1. Setting up Kubernetes cluster:
Kubernetes installation was made with Kargo and Fuel-CCP-Installer wrapper
on top of the 430 nodes with preinstalled Ubuntu Xenial.
You can download the content of the /etc directory of a typical K8S node here:
etc_tarball
This is how Kargo sets up Kubernetes cluster:
- nodes[1-3]: ETCD nodes
- nodes[4-5]: K8S masters
- nodes[6-430]: K8S nodes (minions)
Kargo was lanched with the following parameters:
cluster_id: "1.0.0.1"
docker_options: "--insecure-registry 10.3.60.54:5000 -D"
#upstream_dns_servers: [10.3.60.52]
upstream_dns_servers: [8.8.8.8, 8.8.4.4]
nameservers: [8.8.8.8, 8.8.4.4]
kube_service_addresses: 10.224.0.0/12
kube_pods_subnet: 10.240.0.0/12
kube_network_node_prefix: 22
kube_apiserver_insecure_bind_address: "0.0.0.0"
dns_replicas: 3
dns_cpu_limit: "100m"
dns_memory_limit: "512Mi"
dns_cpu_requests: "70m"
dns_memory_requests: "70Mi"
deploy_netchecker: false
download_run_once: false
download_localhost: false
See the versions of the used software below:
| Software | Version |
| Ubuntu | Ubuntu 16.04.1 LTS |
| Fuel-CCP-Installer | 6b26170f70e523fb04bda8d6f15077d461fba9de |
| Kargo | 016b7893c64fede07269c01cac31e96c8ee0d257 |
| Kubernetes | v1.5.3 |
| ETCD | v3.1.0 (API version 2) |
4.1.3.2. Test tools
We did not use any specific tools to collect required metrics during ETCD load tests. Prometheus monitoring with Telegraf agent and Grafana visualization were utilized for these purposes as a part of our Monitoring_methodology for containerized systems. The only well-known tools that we brought into play were:
4.2. Testing process
In the first scenario with MMM we had been using “200 pods per each node” setting and, thus, spawned huge amounts of pods. Snap from the prepare-minion.py of the MMM suit:
# pods per node:
PODS = 200
def main():
# nodes range:
nodes = ["node{}".format(x+1) for x in xrange(10, 430)]
In the second scenario with Hoseproxy we launched lots of services (100 services per step in 100 parallel threads):
./hoseproxy -ns minions -src master -master http://localhost:8080 -nparallel 100 -nservices 100 -nsteps 10000
For both scenarios we were following next algorithm:
1. Launch a load test and wait until ETCD performance starts to significantly degrade or Kubernetes will not be able to spawn any more of pods or services (for the certain case).
2. Collect data series for each required ETCD metric and K8S pods/services counters within time range of the test. Save it in a text file. All resulted text files must have the same number of lines as we set the same <step=1s> parameter for each fetched metric data series.
# collecting data for a metric "etcd_server_proposals_pending":
curl -q 'http://<prometheus_server>/api/v1/query_range?query=etcd_server_proposals_pending&start=<test_start>&end=<test_end>&step=1s' \
| jq '.data.result[] | select(.metric.instance == "<instance>") | .values[] | .[1]'  | tr -d '"' > etcd_server_proposals_pending.txt
3. As the all necessary metrics are withdrawn - join all text files into a single csv file by interleaving metric values from each text file with paste.
paste -d',' k8s_services_number_of_services_total.txt process_resident_memory_bytes.txt \
etcd_debugging_snap_save_total_duration_seconds_bucket.txt etcd_disk_backend_commit_duration_seconds_bucket.txt \
etcd_http_failed_total.txt etcd_network_peer_received_bytes_total.txt etcd_network_peer_sent_bytes_total.txt \
etcd_server_proposals_pending.txt > svc_vs_etcd_29_03.csv
4. Plot resulted data in the terms of “PODS vs metrics” and “Services vs metrics” dependency.
4.3. Results
After all the tests were successfully conducted, following data was acquired:
4.3.1. Case 1: “ETCD vs PODS”
During this case ETCD cluster resulted in significant performance degradation. We were able to collect ETCD metrics up to ~ 40K pods and ETCD cluster nodes started to log messages like:
2017-03-29 15:50:15.586058 W | etcdserver: apply entries took too long [106.743668ms for 1 entries]
2017-03-29 15:50:15.586080 W | etcdserver: avoid queries with large range/delete range!
After that we lost ability to collect metrics (due too big API timeouts for both ETCD and K8S). When pods number reached ~80K point one of the ETCD cluster member died out with last log entries like:
2017-03-29 19:17:20.325368 E | etcdserver: publish error: etcdserver: request timed out
2017-03-29 19:17:26.850195 E | rafthttp: failed to decode raft message (rafthttp: error limit exceeded)
ETCD session leader logs for the same time:
2017-03-29 19:17:02.013860 W | rafthttp: database snapshot [index: 617915518, to: d0b191dfe9d8dd31] failed to be sent out
2017-03-29 19:17:02.669013 W | etcdserver: failed to send out heartbeat on time (exceeded the 250ms timeout for 724.9550
2017-03-29 19:17:02.669050 W | etcdserver: server is likely overloaded
It is worth to mention that ETCD instances had been running with no limitation settings on the consumption of system resources.
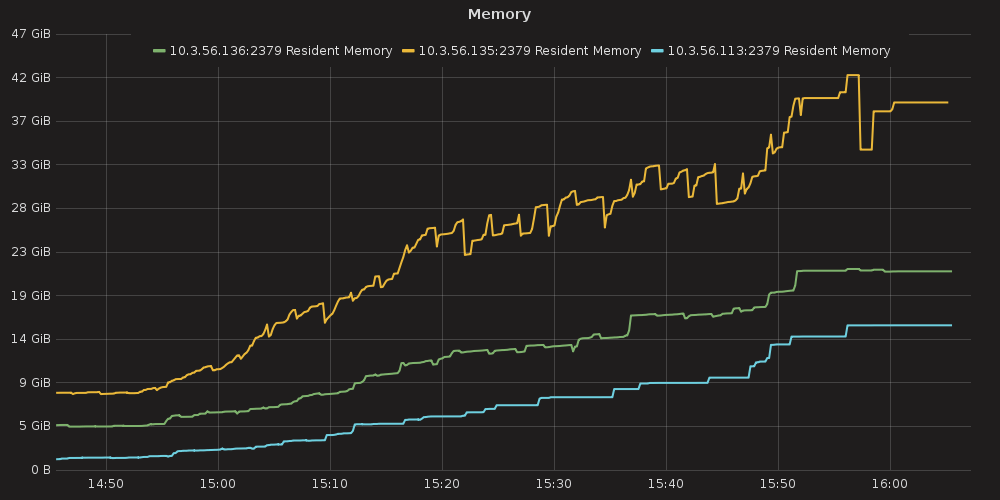
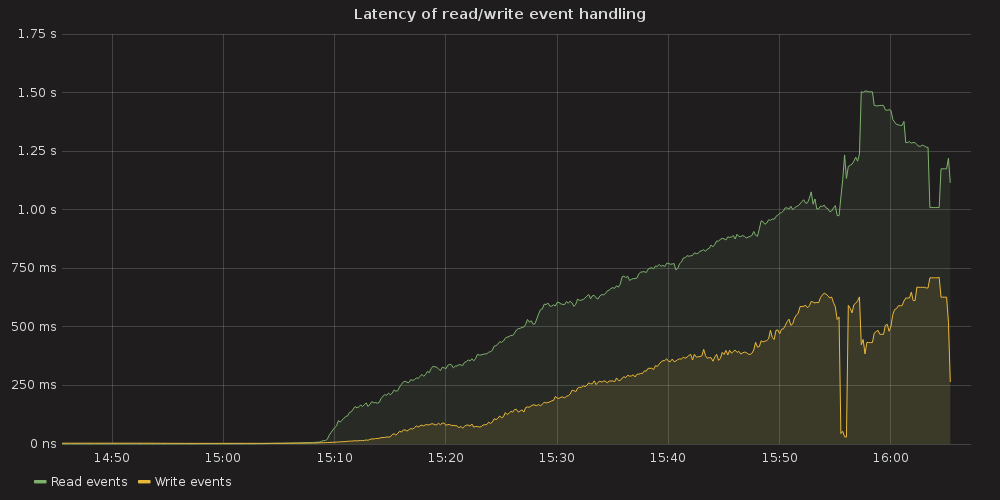
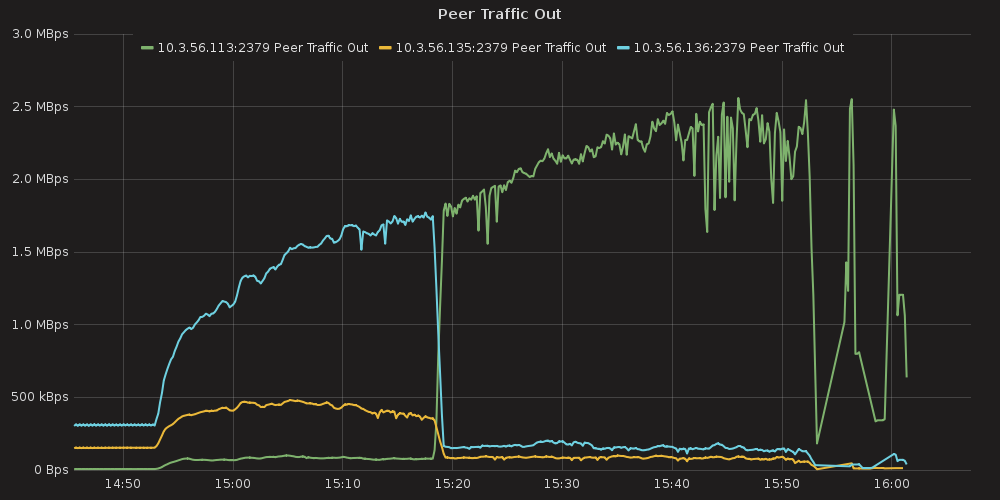
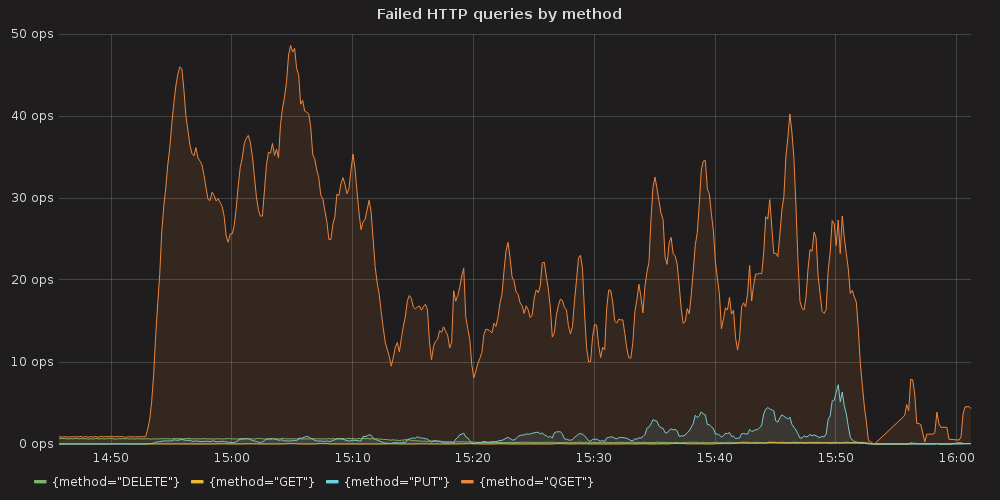
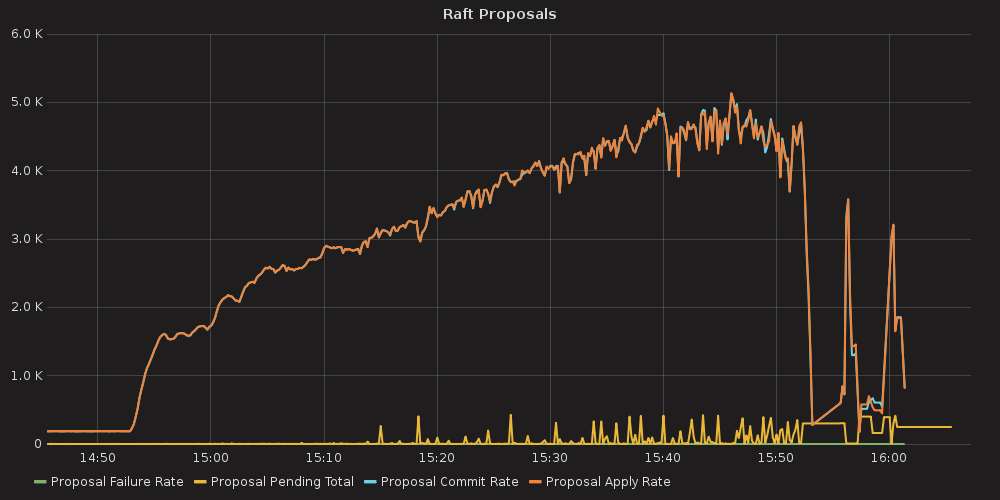
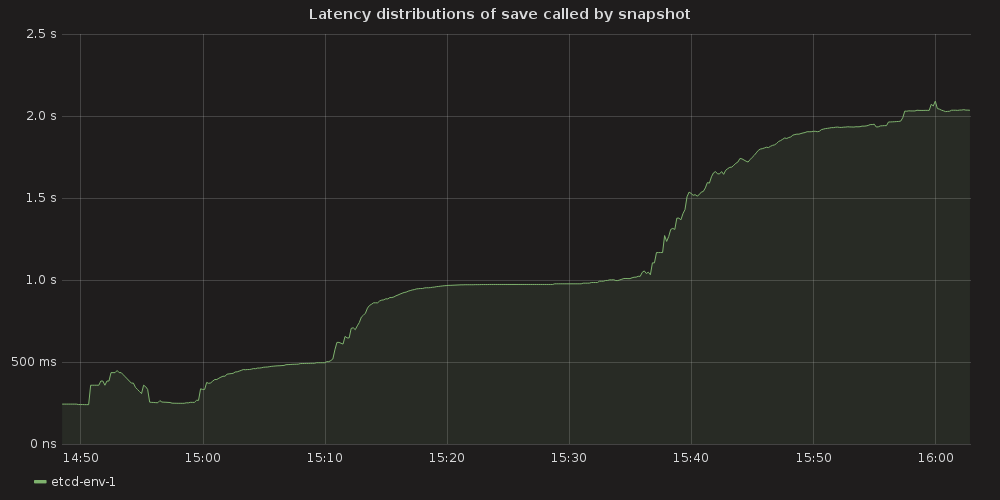
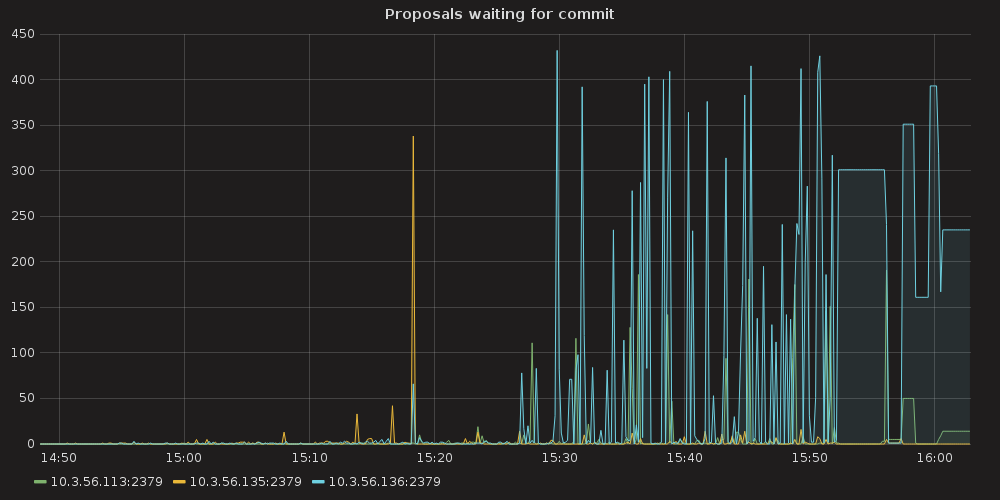
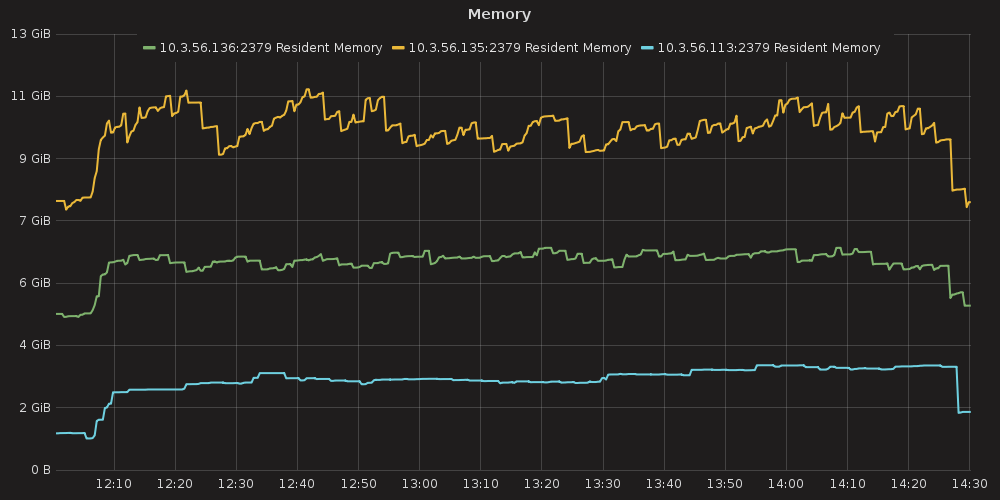
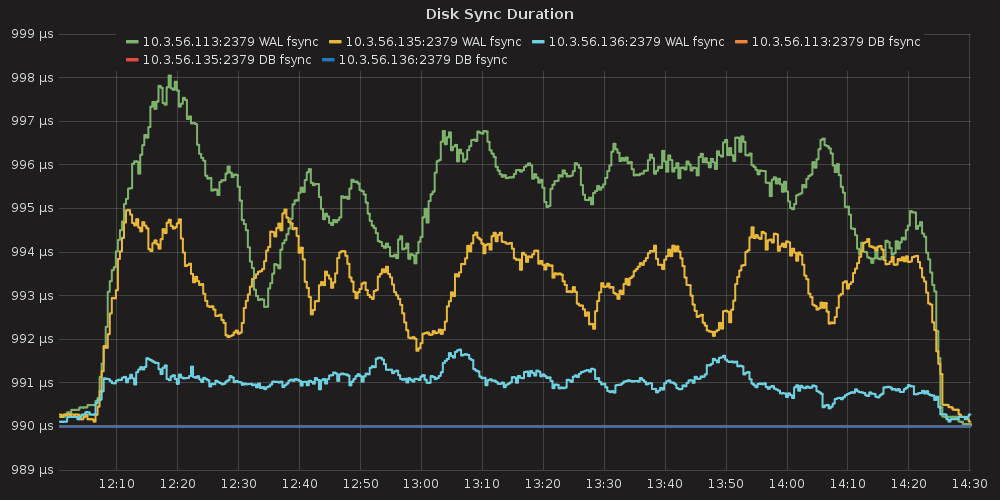
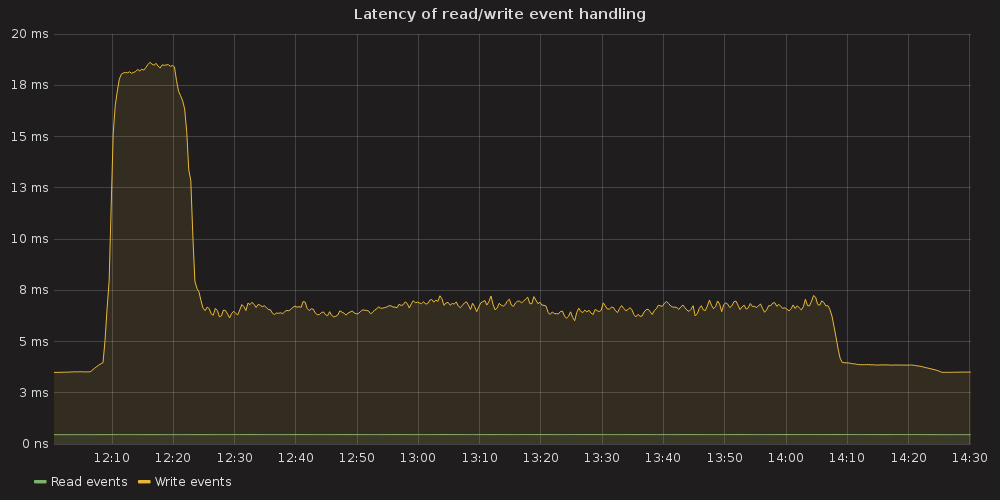
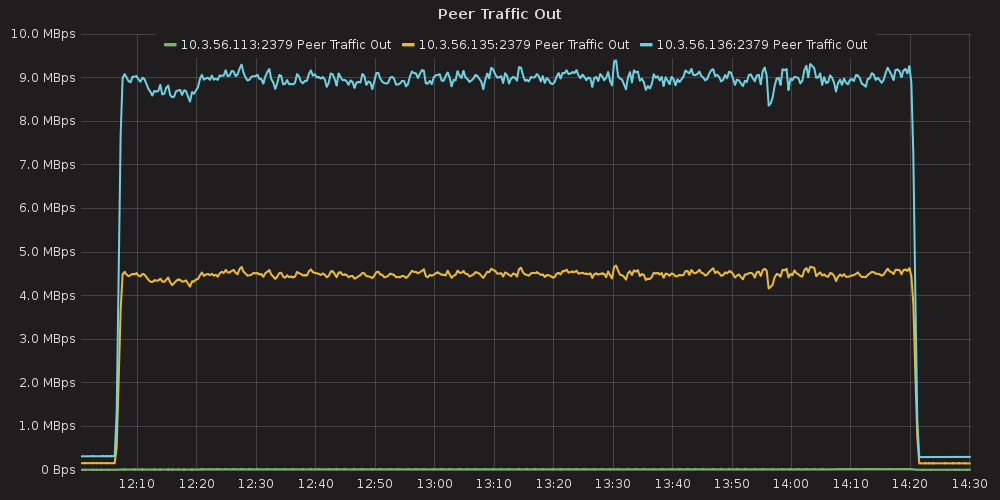
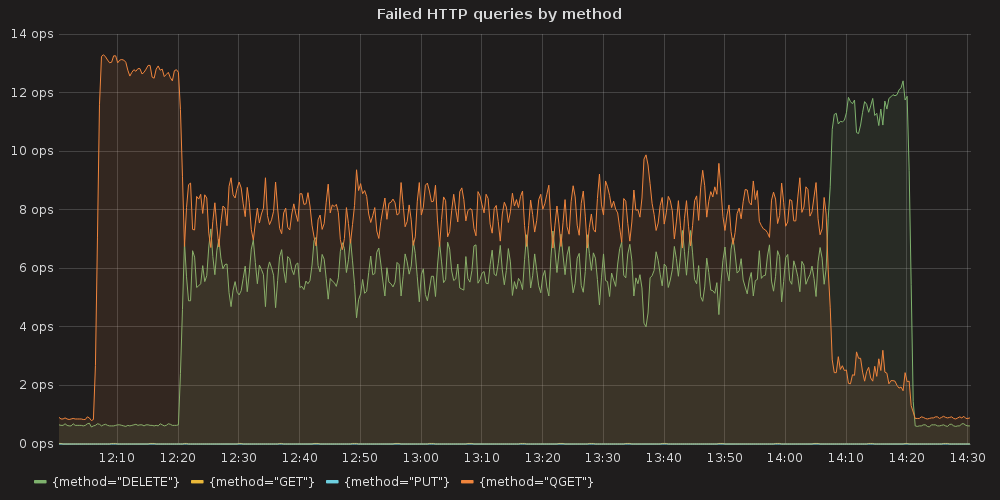
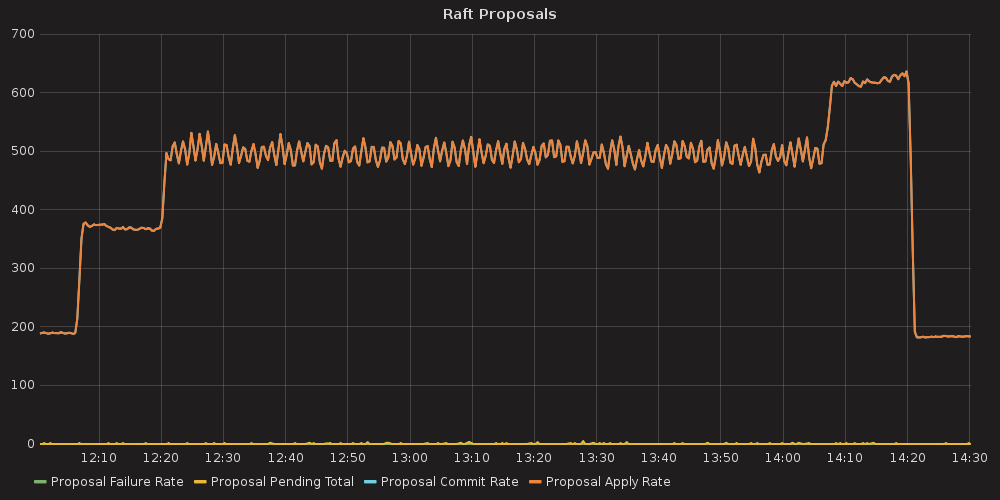
Grafana plots showing ETCD performance during this test:
4.3.1.1. ETCD performance(time series graphs)
|

|
|
|
|
|
|
|
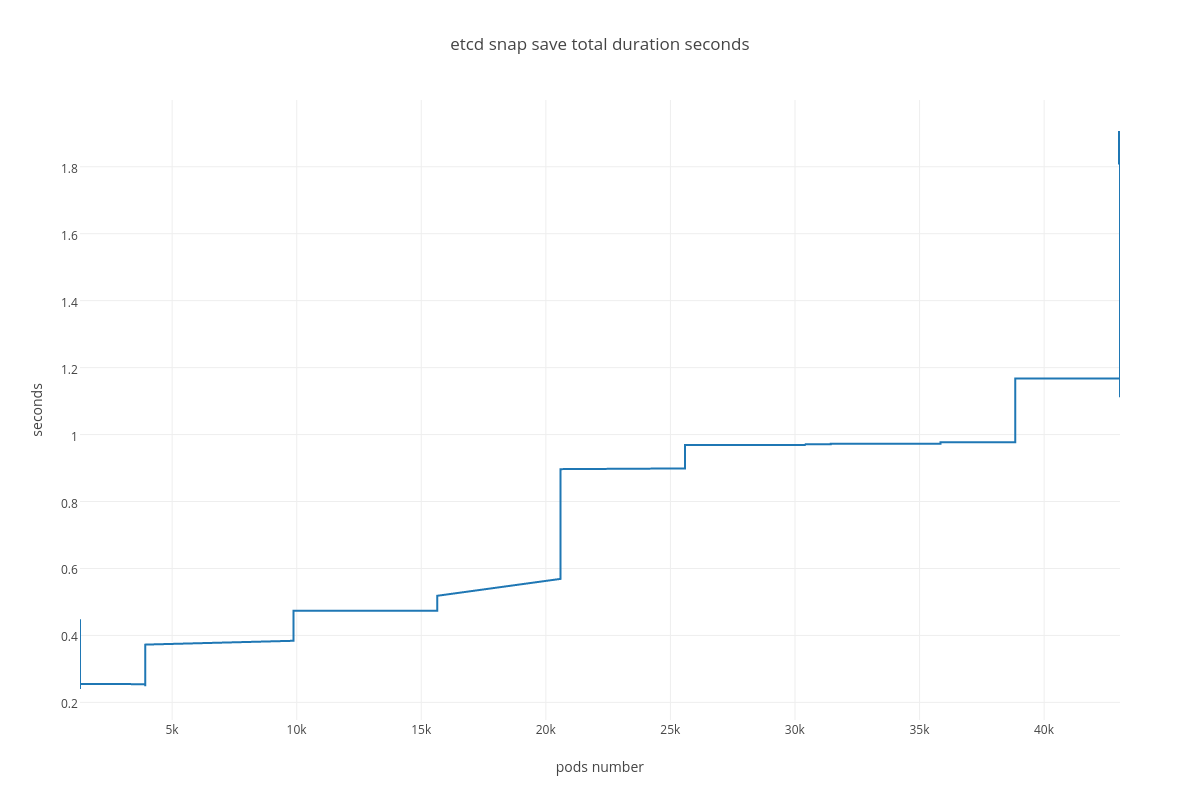
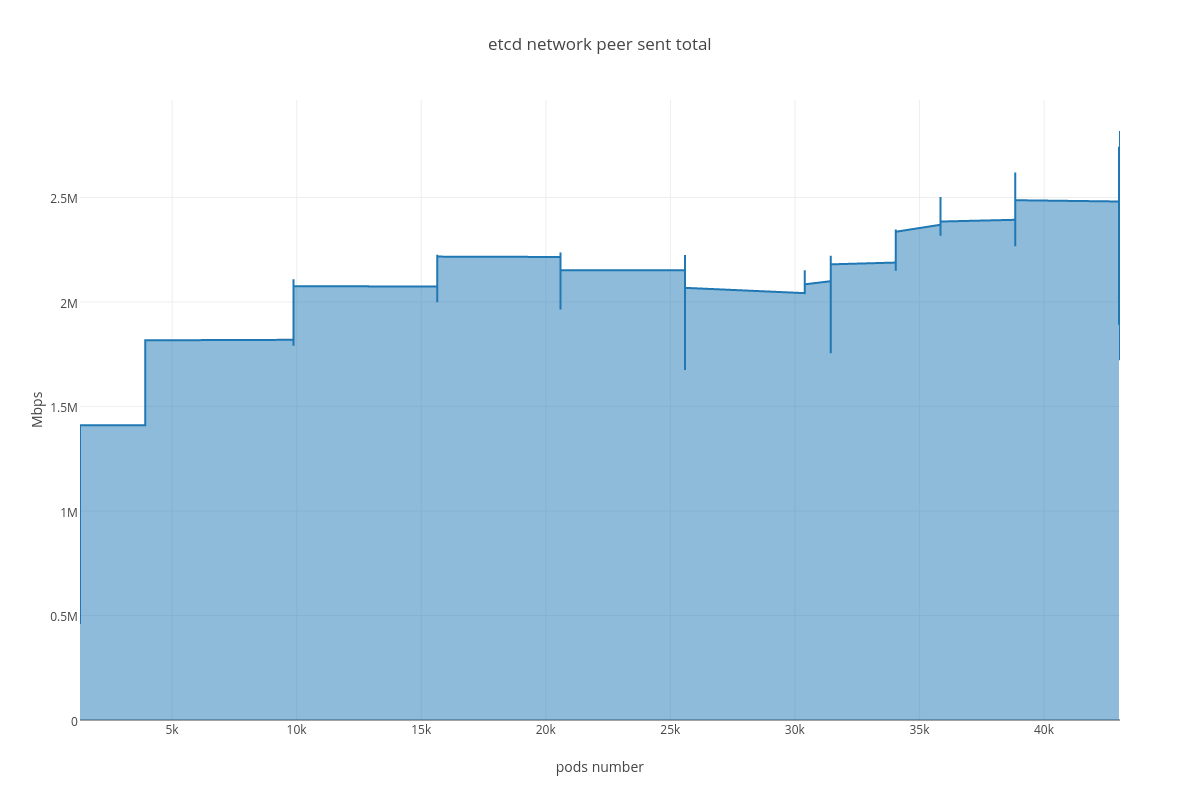
Custom plots showing “metric vs pods number” dependency:
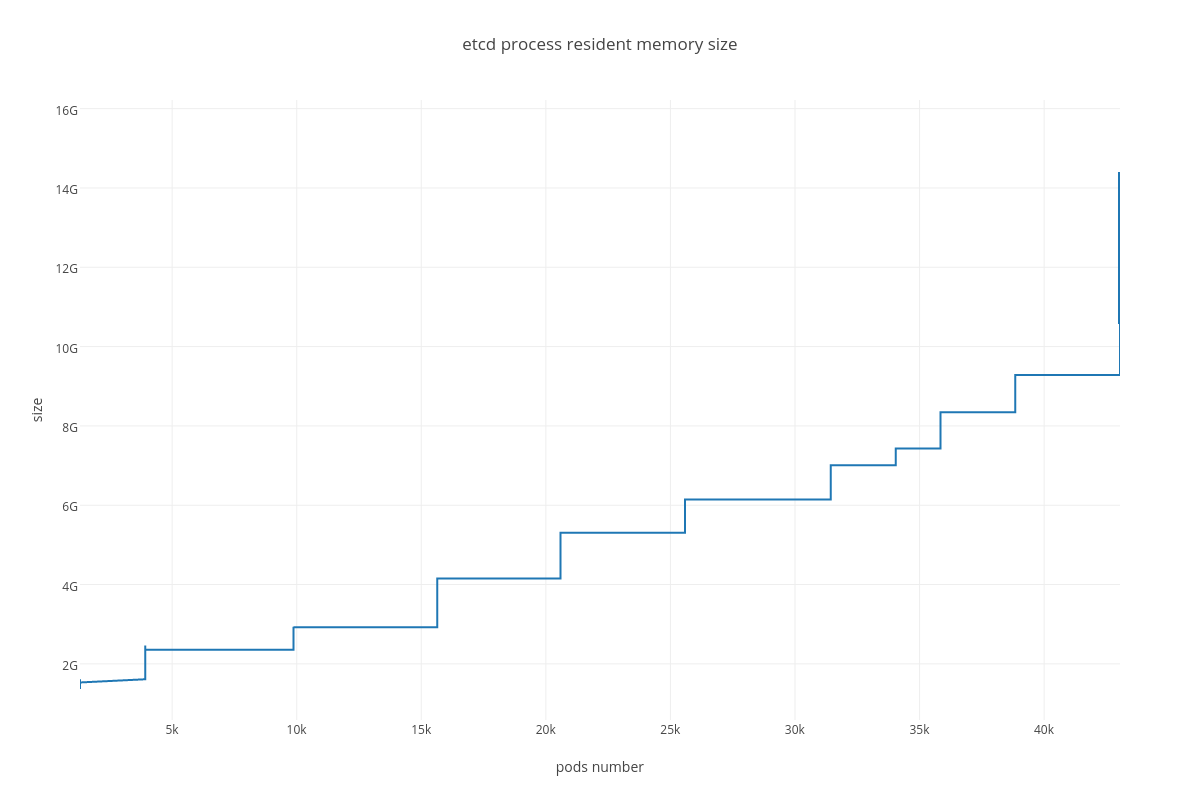
4.3.1.2. ETCD performance(number of pods dependency)
|
|
|
|
|
|
4.3.2. Case 2: “ETCD vs SERVICES”
Testing process for this case resulted in K8S stuck on the point of ~ 10K services and each new endpoint spawn took bigger and bigger amount of time. Some of the ETCD nodes reported increased latencies for their operations:
2017-03-27 14:00:55.787485 W | etcdserver: apply entries took too long [160.769033ms for 1 entries]
2017-03-27 14:00:55.787515 W | etcdserver: avoid queries with large range/delete range!
But overall ETCD performance seemed to be stable.
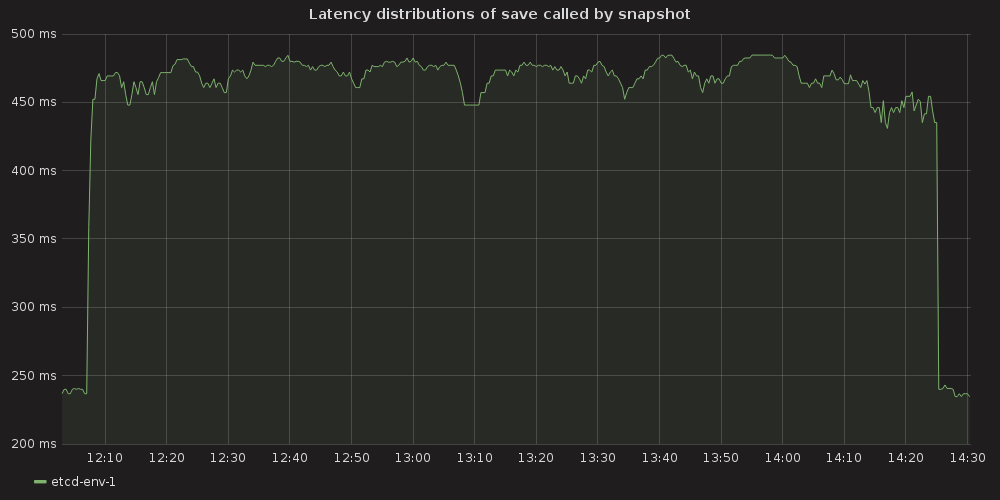
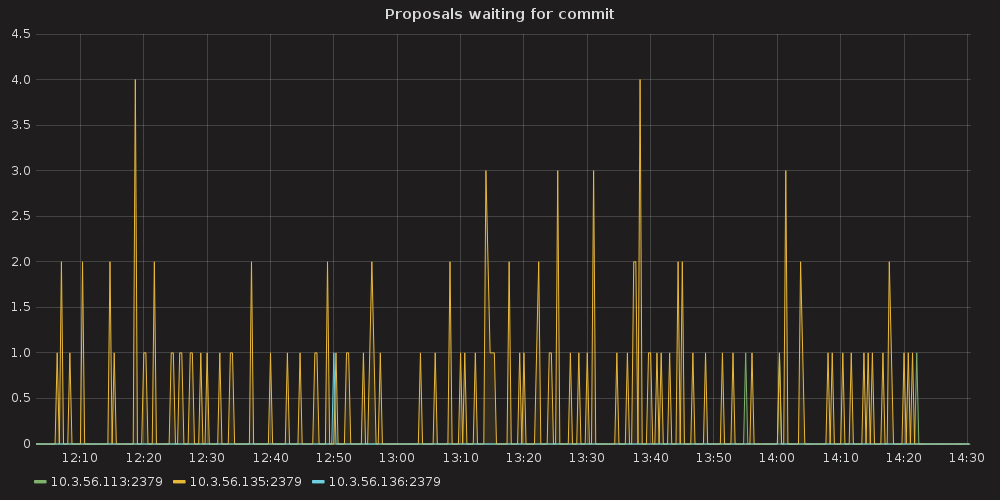
4.3.2.1. ETCD performance(time series graphs)
|
|
|
|
|
|
|
|
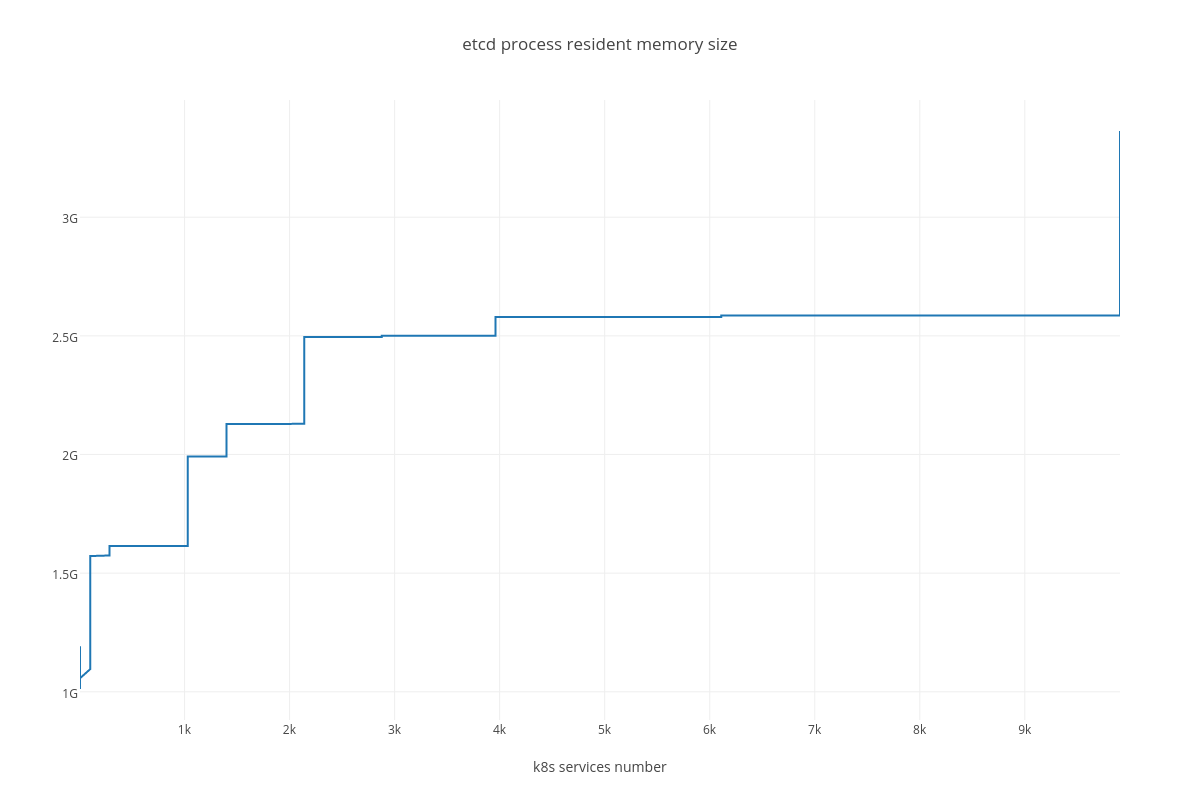
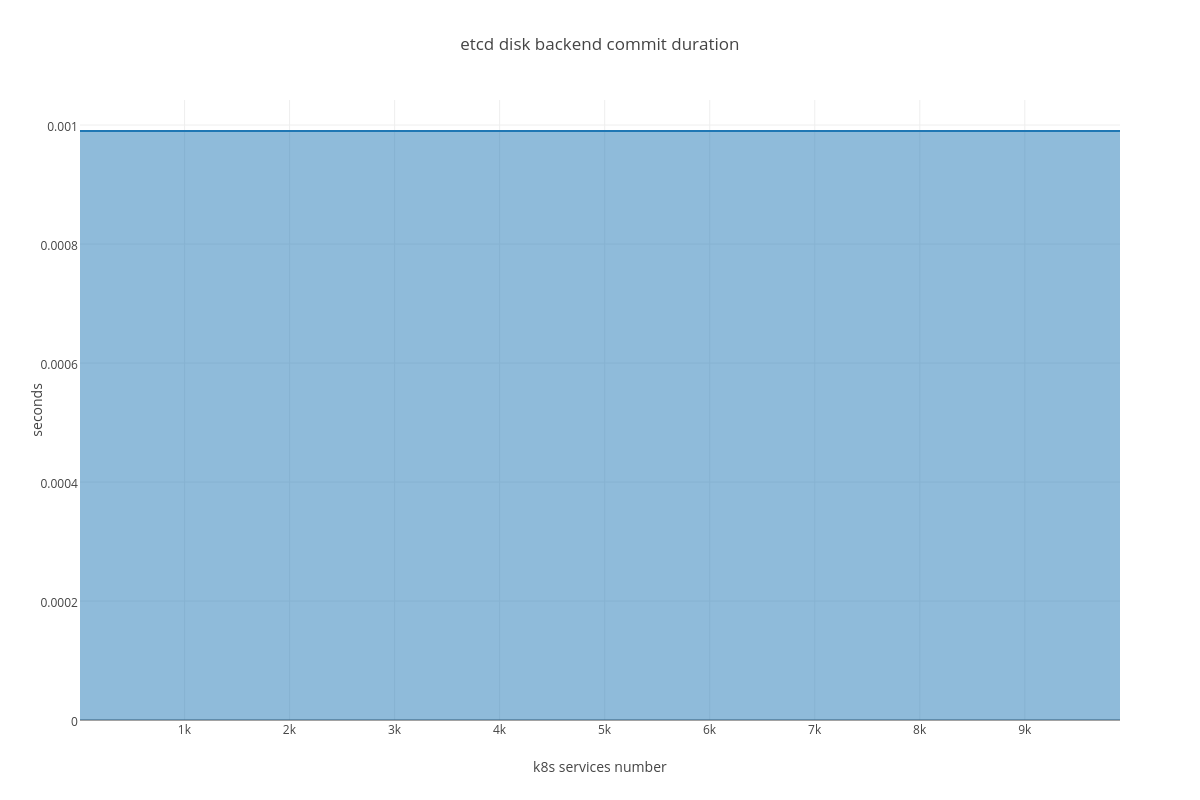
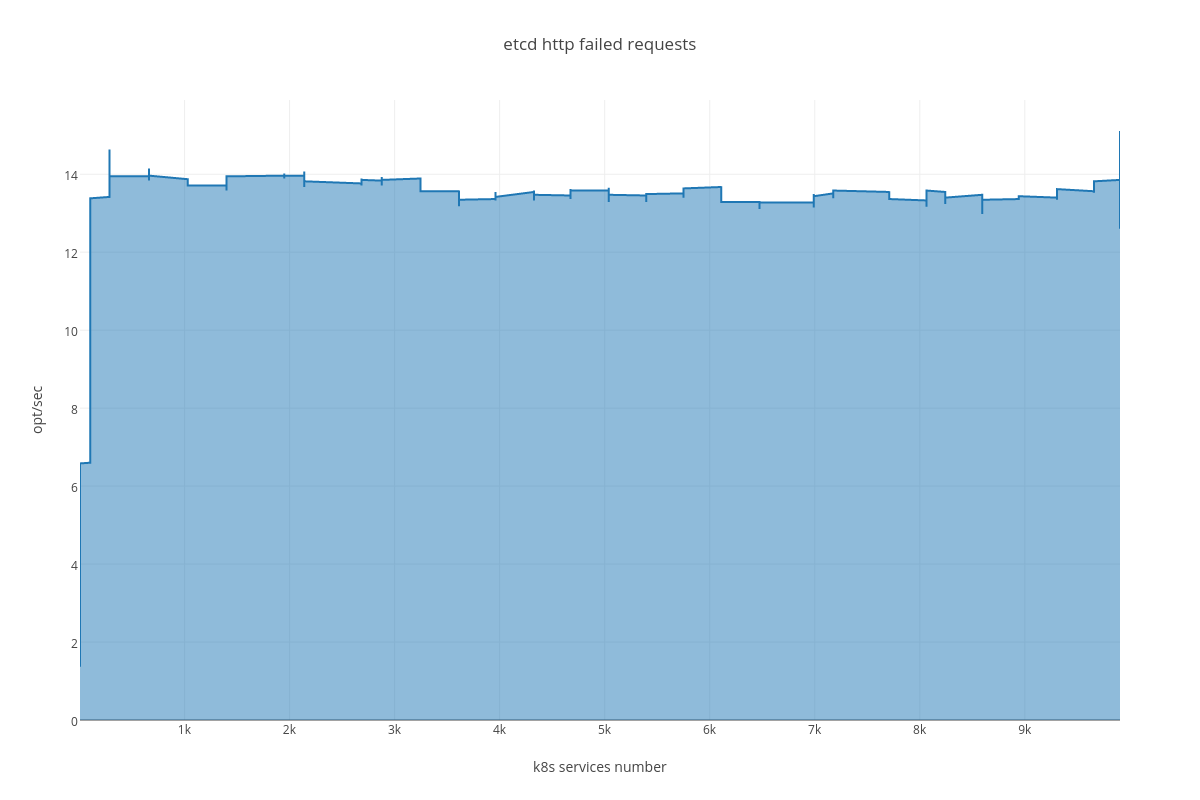
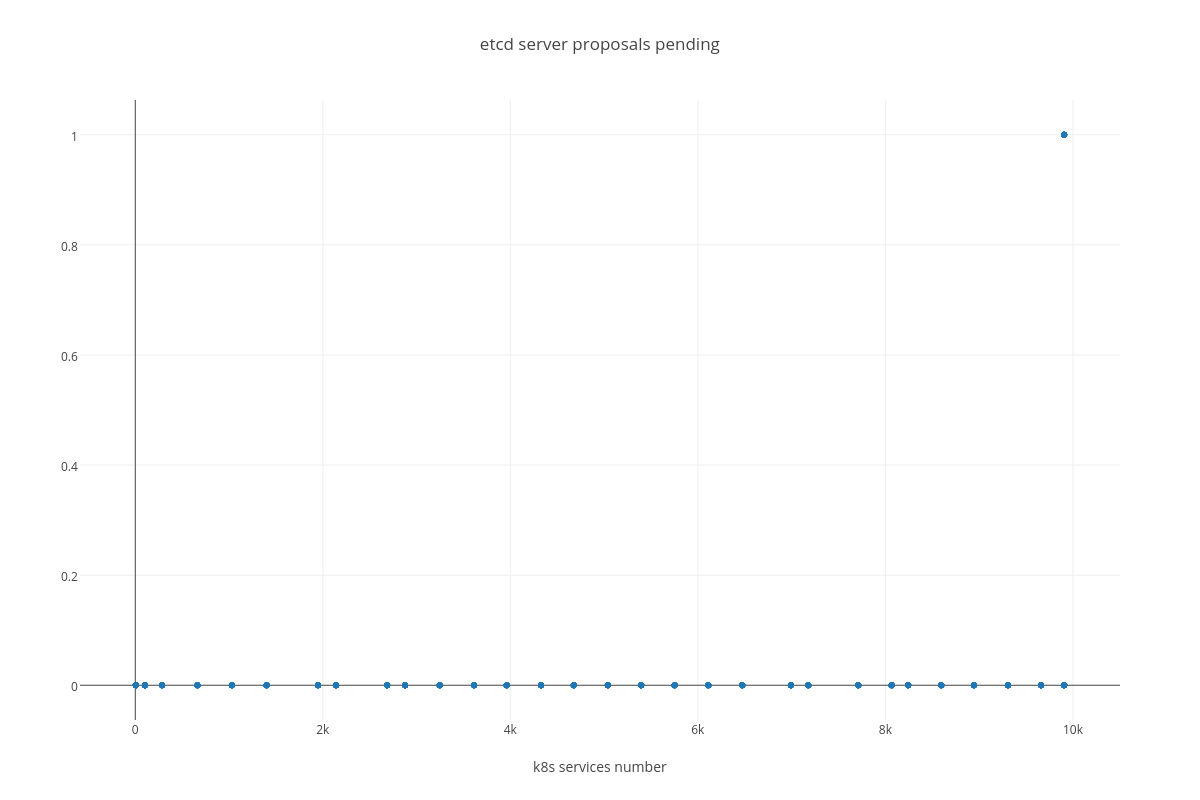
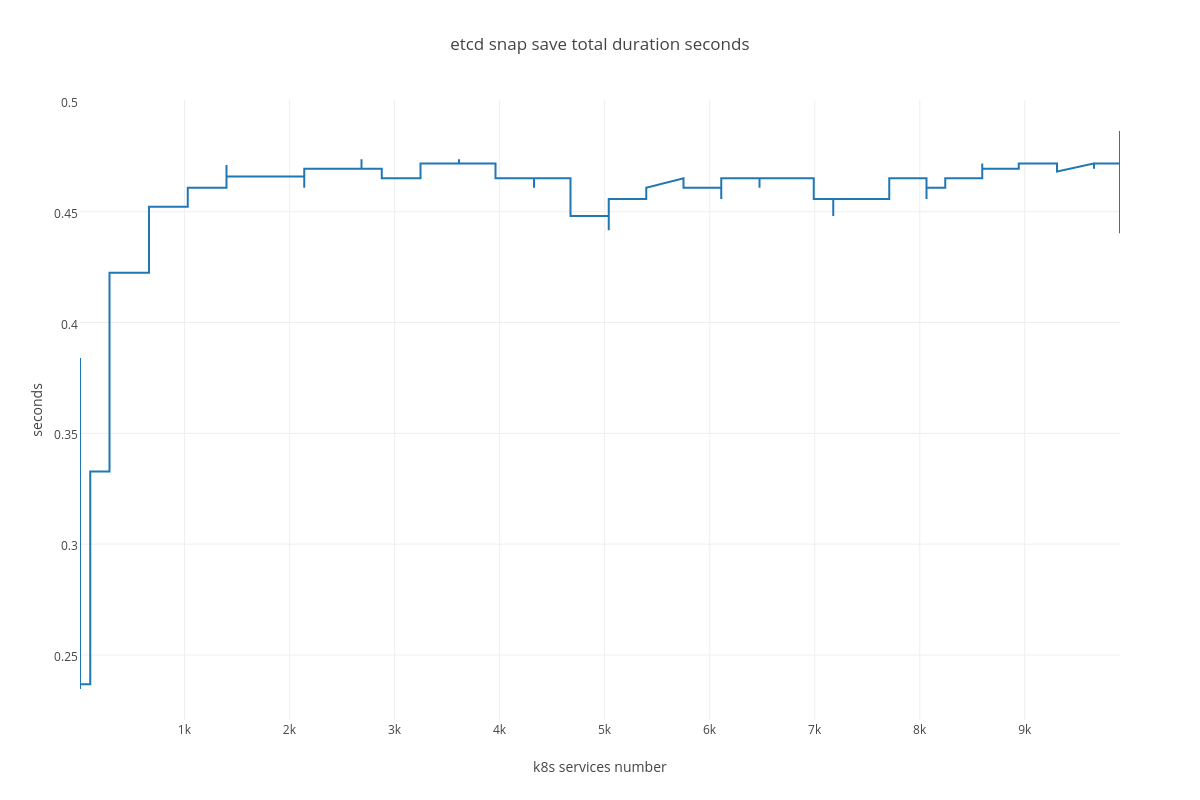
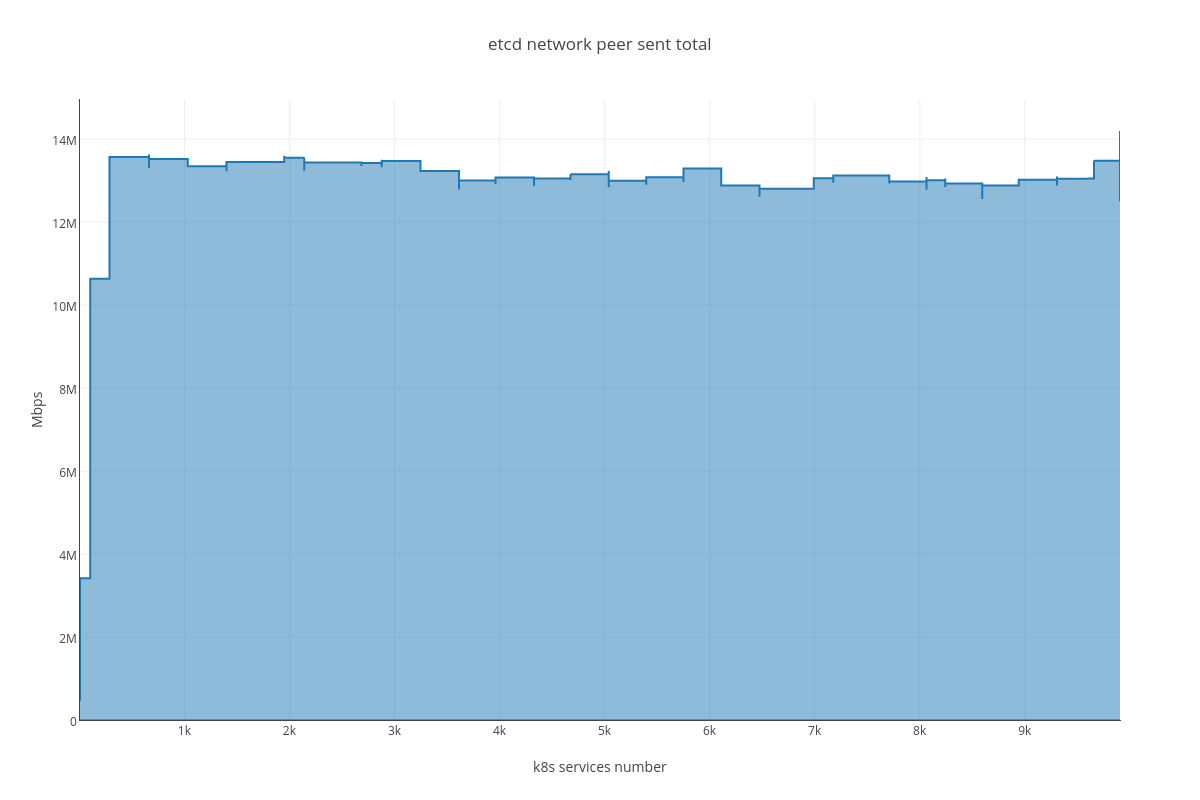
4.3.2.2. ETCD performance(number of services dependency)
|
|
|
|
|
|
4.3.3. Analysis
4.3.3.1. Case 1 (ETCD vs PODS)
As we can determine from the graphs, increase of pods number heavily affects:
- RAM consumption
Resident memory usage grew from 2GB up to 40GB during the test ( process_resident_memory_bytes )
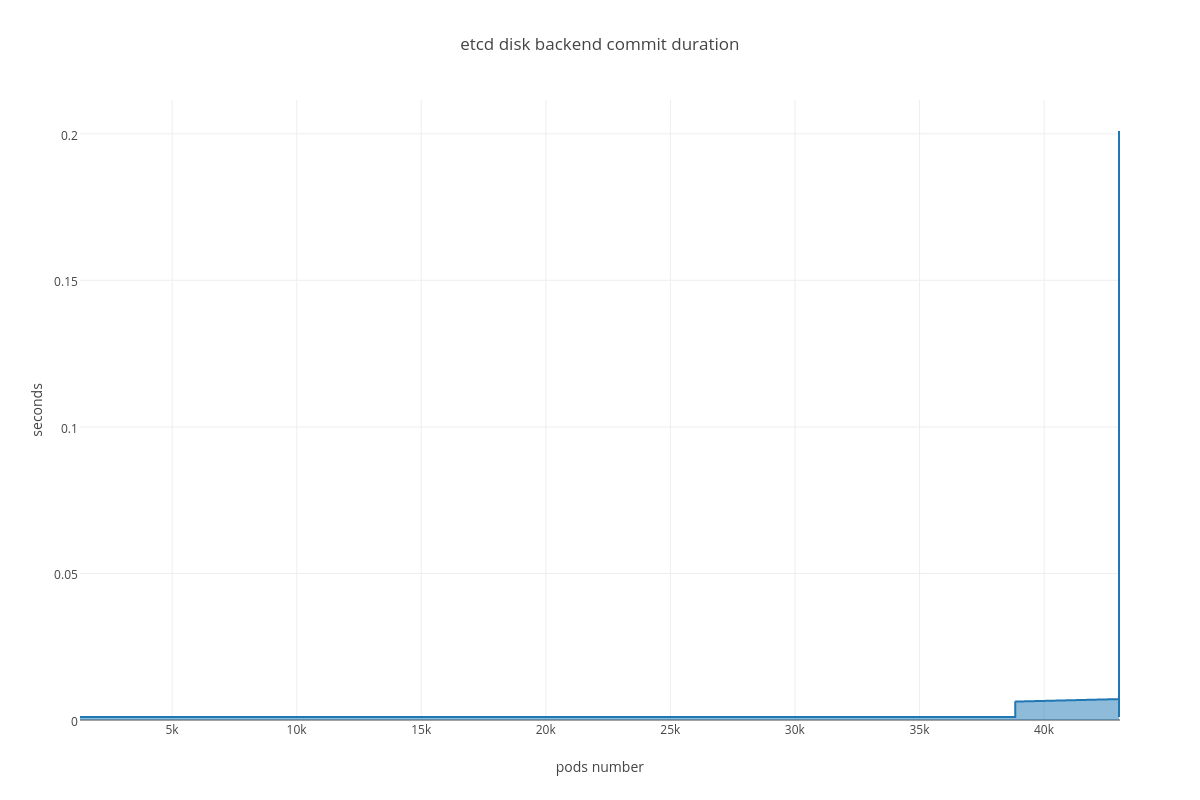
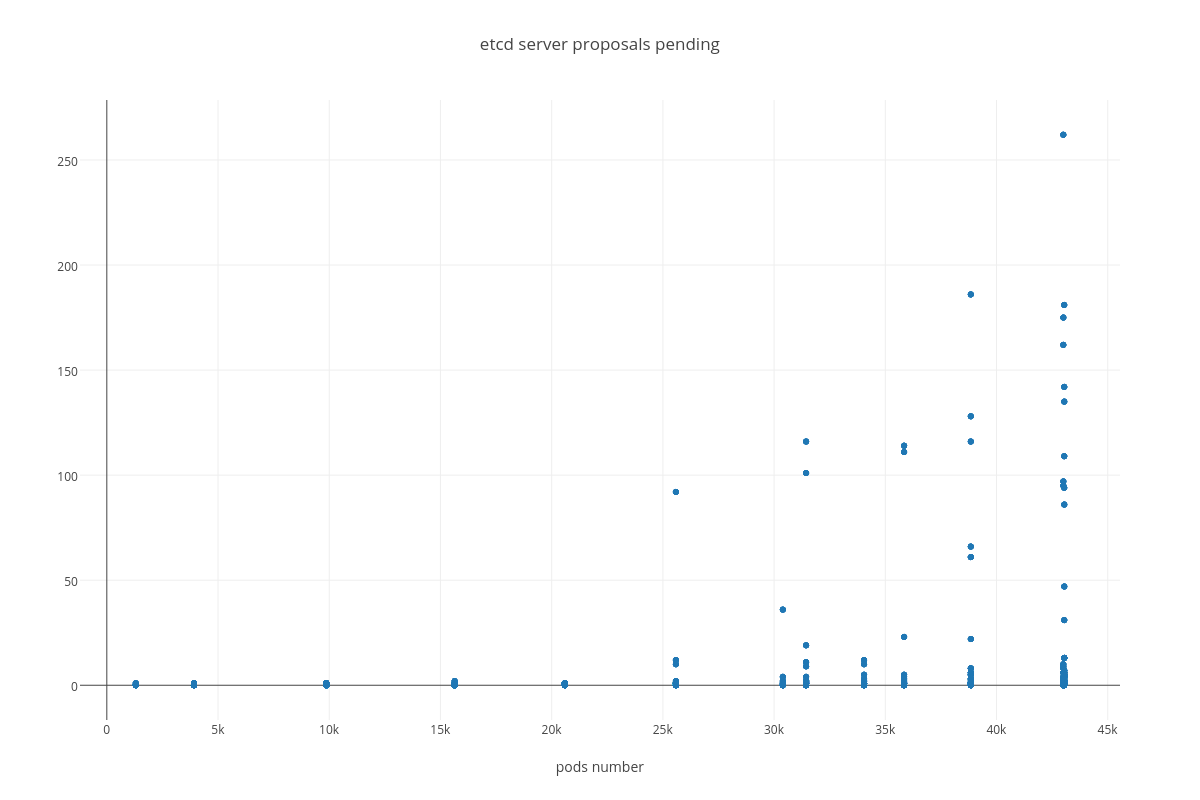
- DISK IO operations
With the more requests for a change (proposal) are coming, the bigger is a queue/latency for sync operations like:
- snapshot save ( etcd_debugging_snap_save_total_duration_seconds_bucket )
- disk sync ( etcd_disk_wal_fsync_duration_seconds_bucket, etcd_disk_backend_commit_duration_seconds_bucket )
- proposal commit ( etcd_server_proposals_pending )
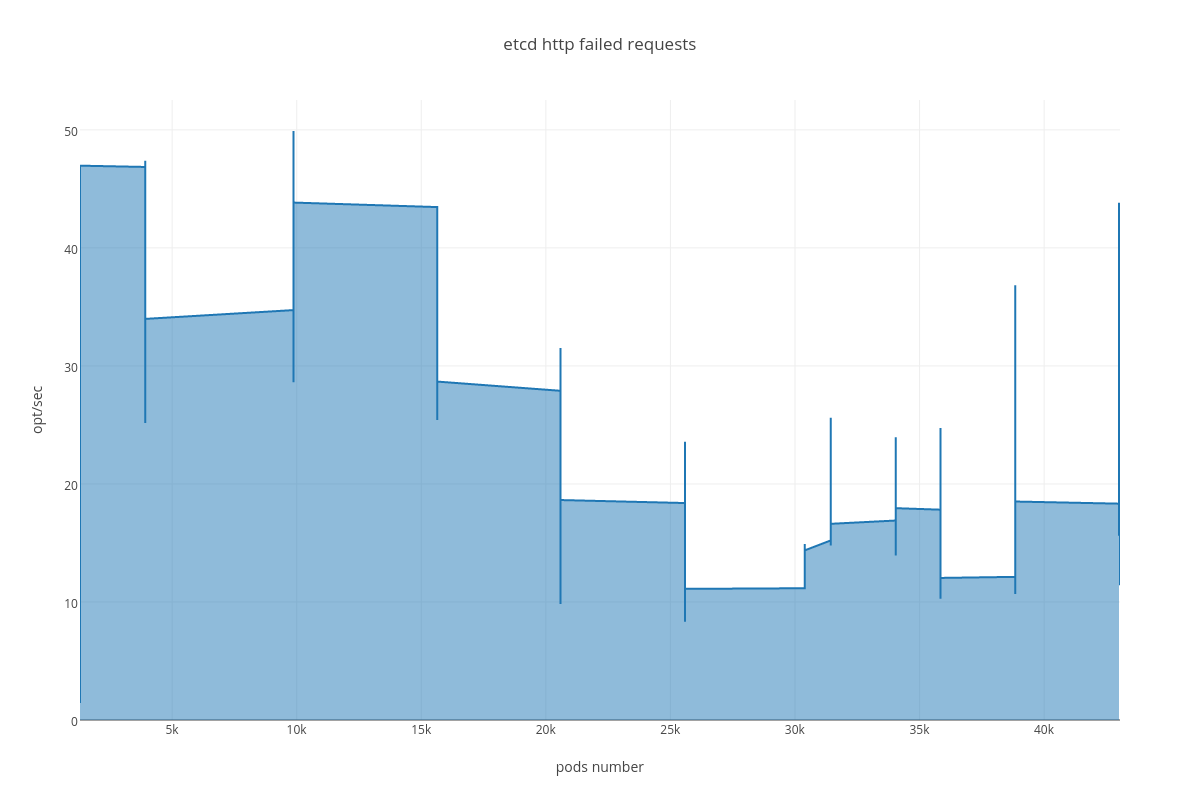
Also we can see an arisen number of http errors for GET queries ( etcd_http_failed_total )
4.3.3.2. Case 2 (ETCD vs SERVICES)
For this case we can infer the same dependency between ETCD and # of services, but impact is much lesser than in the case number 1. The only thing that differ this case from the previous is slightly bigger amount of peer network traffic ( etcd_network_peer_sent_bytes_total ).
4.4. Applications
4.4.1. prepare-minion.py
import os
import shlex
import subprocess

import jinja2

PODS = 200


def render(tpl_path, context):
    path, filename = os.path.split(tpl_path)
    return jinja2.Environment(
        loader=jinja2.FileSystemLoader(path or './')
    ).get_template(filename).render(context)


def create(node):
    service_name = "minion-rc-{}".format(node)
    file_name = "{}.yaml".format(service_name)

    # Create YAML file for new service
    template = render("minion-rc.yaml", {"node": node, "replicas": PODS})
    f = open(file_name, "w")
    f.write(template)
    f.close()

    f = open("nodes.txt", 'a')
    f.write("minion-{}\n".format(node))
    f.close()

    cmd = "kubectl create -f {}".format(file_name)
    args = shlex.split(cmd)

    proc = subprocess.Popen(args, stdout=subprocess.PIPE)
    (out, err) = proc.communicate()

    # Delete YAML file
    os.remove(file_name)


def main():
    # List nodes
    nodes = ["node{}".format(x+1) for x in xrange(20, 430)]
    broken_nodes = ['node16', 'node170', 'node357']
    for n in broken_nodes:
        try:
            nodes.remove(n)
        except ValueError:
            pass

    for n in nodes:
        create(n)


if __name__ == '__main__':
    main()