1. Results of measuring performance of Mesos Marathon
| Abstract: | This document includes performance test results for Mesos as a container platform for Docker with Marathon. All tests have been performed regarding Measuring performance of container cluster systems |
|---|
1.1. Environment description
1.1.1. Cluster description
- 3 master nodes with Mesos, Marathon and Zookeeper
- 189 mesos slaves nodes
1.1.2. Software versions
- Mesos - 0.27.0
- Marathon - 0.15.2
- Zookeeper - 3.4.5
- Docker - 1.10.2
1.1.3. Running options
- Marathon extra options are “-Xmx2048m –max_tasks_per_offer 20”
1.1.4. Hardware configuration of each server
| server | vendor,model | HP,DL380 Gen9 |
| operating_system | 3.13.0-76-generic
Ubuntu-trusty
x86_64
|
|
| CPU | vendor,model | Intel,E5-2680 v3 |
| processor_count | 2 | |
| core_count | 12 | |
| frequency_MHz | 2500 | |
| RAM | vendor,model | HP,752369-081 |
| amount_MB | 262144 | |
| NETWORK | interface_name | p1p1 |
| vendor,model | Intel,X710 Dual Port | |
| bandwidth | 10G | |
| STORAGE | dev_name | /dev/sda |
| vendor,model | raid10 - HP P840
12 disks EH0600JEDHE
|
|
| SSD/HDD | HDD | |
| size | 3,6TB |
1.1.5. Network scheme and part of configuration of hardware network switches
Network scheme of the environment:
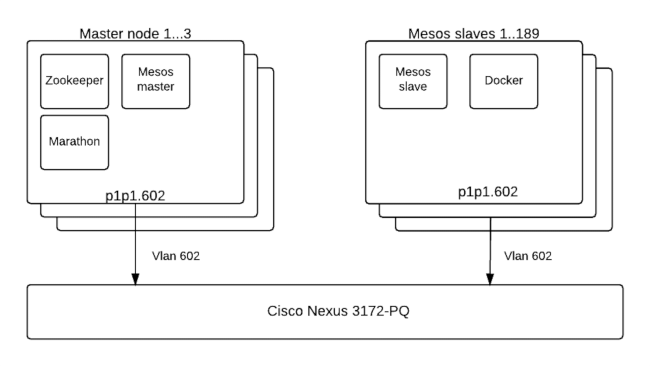
Here is the part of switch configuration for each switch port which connected to p1p1.603 interface of a server:
switchport mode trunk
switchport trunk native vlan 600
switchport trunk allowed vlan 600-602,630-649
spanning-tree port type edge trunk
spanning-tree bpduguard enable
no snmp trap link-status
1.2. Results
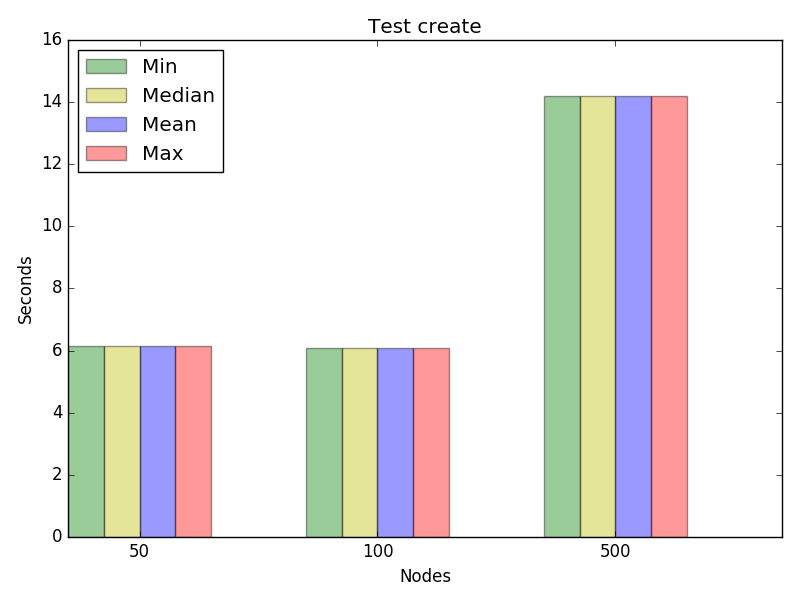
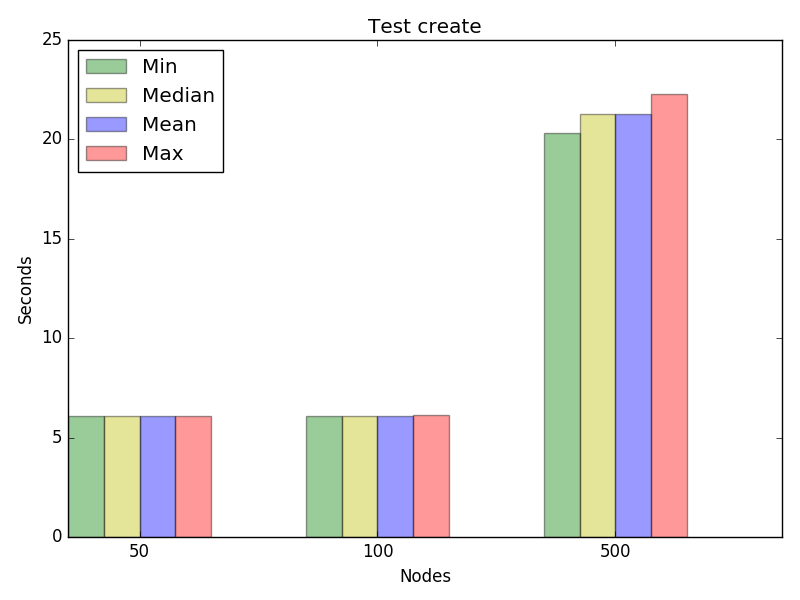
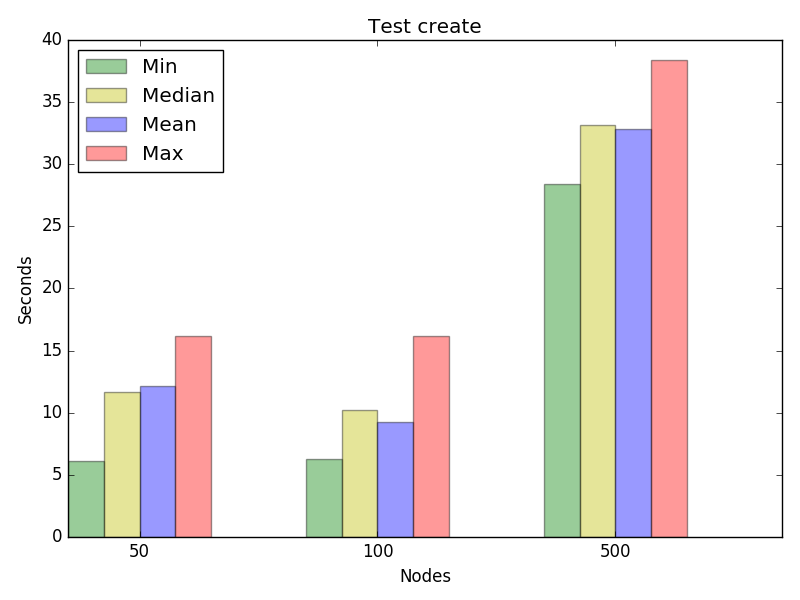
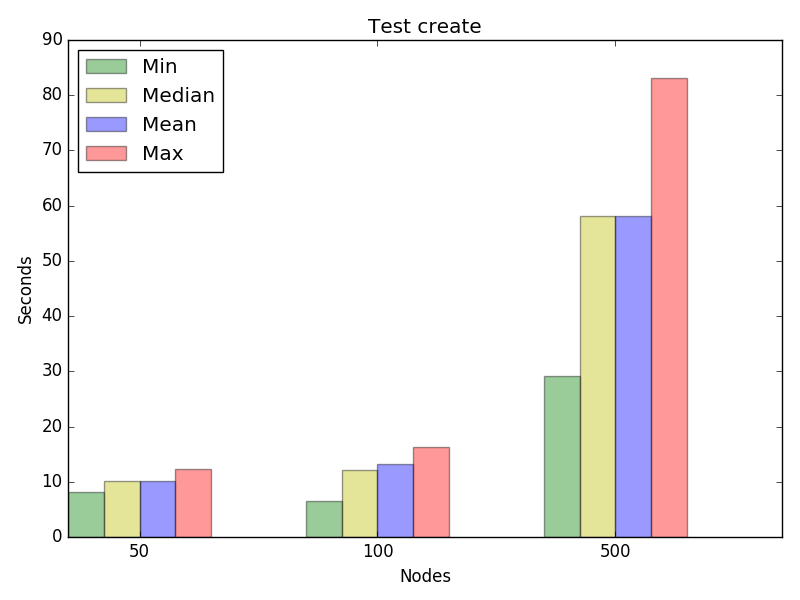
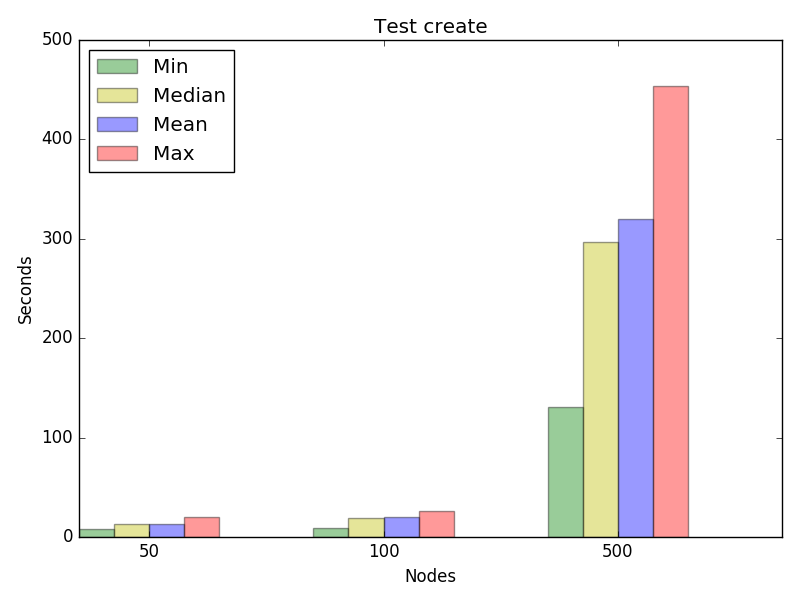
1.2.1. Test create
| CONCURRENCY | NODES_NUMBER_PER_APPLICATION | APPLICATION_OPERATION (sec) | |||
|---|---|---|---|---|---|
| minimum | maximum | average | median | ||
| 1 | 50 | 6.15 | 6.15 | 6.15 | 6.15 |
| 1 | 100 | 6.09 | 6.09 | 6.09 | 6.09 |
| 1 | 500 | 14.18 | 14.18 | 14.18 | 14.18 |
| 2 | 50 | 6.08 | 6.1 | 6.09 | 6.09 |
| 2 | 100 | 6.09 | 6.12 | 6.11 | 6.105 |
| 2 | 500 | 20.3 | 22.27 | 21.29 | 21.285 |
| 4 | 50 | 6.15 | 16.2 | 11.66 | 12.155 |
| 4 | 100 | 6.24 | 16.19 | 10.24 | 9.26 |
| 4 | 500 | 28.39 | 38.42 | 33.13 | 32.86 |
| 8 | 50 | 8.11 | 12.24 | 10.16 | 10.16 |
| 8 | 100 | 6.46 | 16.25 | 12.08 | 13.185 |
| 8 | 500 | 29.12 | 83.03 | 58.19 | 58.06 |
| 16 | 50 | 8.12 | 20.36 | 12.88 | 13.22 |
| 16 | 100 | 9.02 | 26.39 | 19.3 | 20.28 |
| 16 | 500 | 130.43 | 453.85 | 296.59 | 320.07 |
Graph for test create, concurrency 1
Graph for test create, concurrency 2
Graph for test create, concurrency 4
Graph for test create, concurrency 8
Graph for test create, concurrency 16
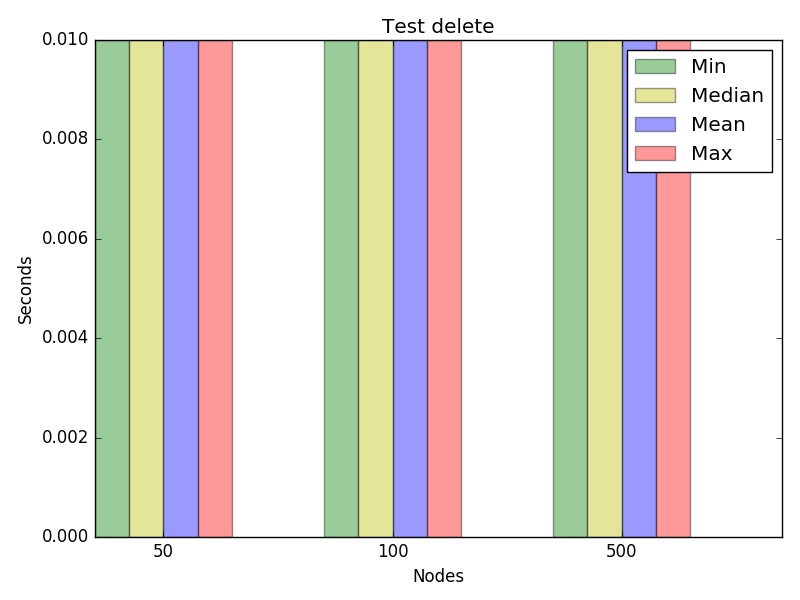
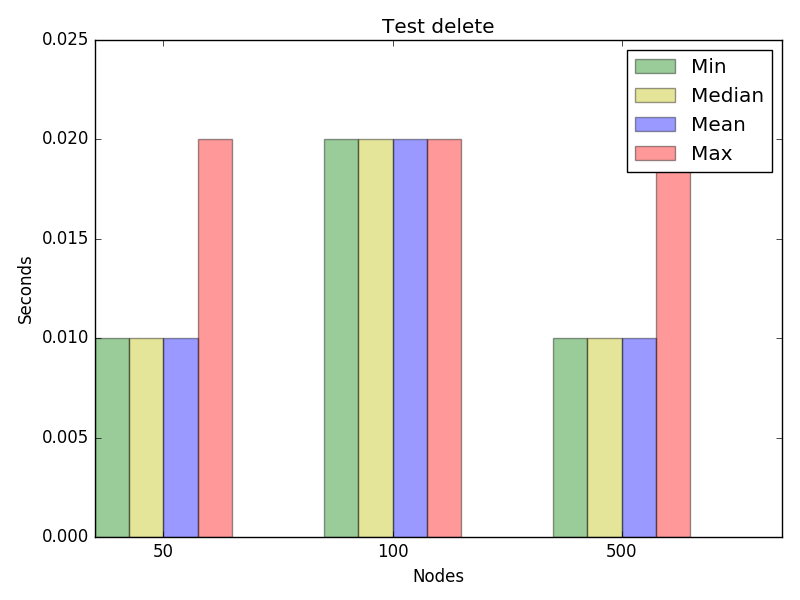
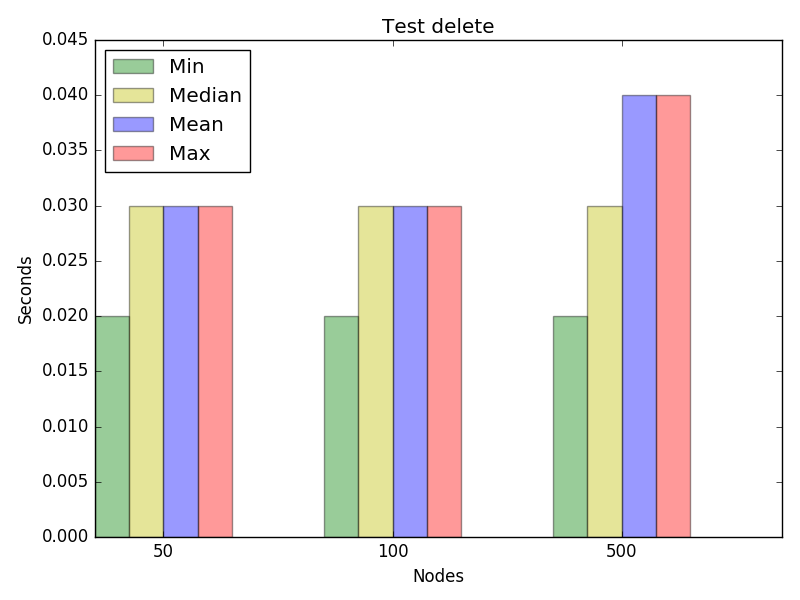
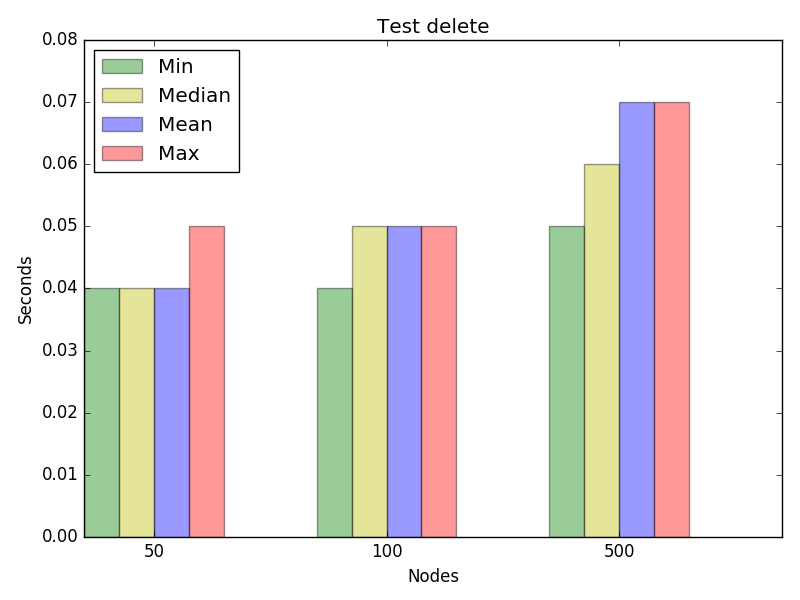
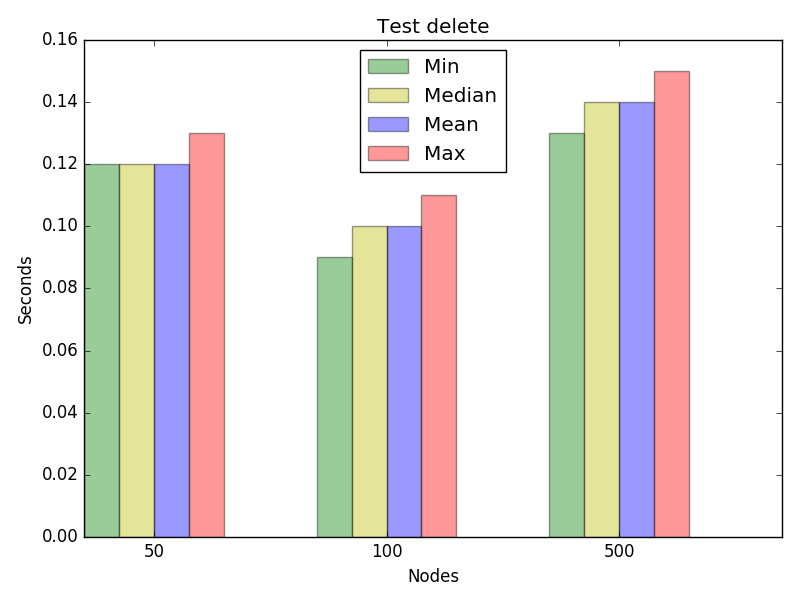
1.2.2. Test delete
| CONCURRENCY | NODES_NUMBER_PER_APPLICATION | APPLICATION_OPERATION (sec) | |||
|---|---|---|---|---|---|
| minimum | maximum | average | median | ||
| 1 | 50 | 0.01 | 0.01 | 0.01 | 0.01 |
| 1 | 100 | 0.01 | 0.01 | 0.01 | 0.01 |
| 1 | 500 | 0.01 | 0.01 | 0.01 | 0.01 |
| 2 | 50 | 0.01 | 0.02 | 0.01 | 0.01 |
| 2 | 100 | 0.02 | 0.02 | 0.02 | 0.02 |
| 2 | 500 | 0.01 | 0.02 | 0.01 | 0.01 |
| 4 | 50 | 0.02 | 0.03 | 0.03 | 0.03 |
| 4 | 100 | 0.02 | 0.03 | 0.03 | 0.03 |
| 4 | 500 | 0.02 | 0.04 | 0.03 | 0.04 |
| 8 | 50 | 0.04 | 0.05 | 0.04 | 0.04 |
| 8 | 100 | 0.04 | 0.05 | 0.05 | 0.05 |
| 8 | 500 | 0.05 | 0.07 | 0.06 | 0.07 |
| 16 | 50 | 0.12 | 0.13 | 0.12 | 0.12 |
| 16 | 100 | 0.09 | 0.11 | 0.1 | 0.1 |
| 16 | 500 | 0.13 | 0.15 | 0.14 | 0.14 |
Graph for test delete, concurrency 1
Graph for test delete, concurrency 2
Graph for test delete, concurrency 4
Graph for test delete, concurrency 8
Graph for test delete, concurrency 16
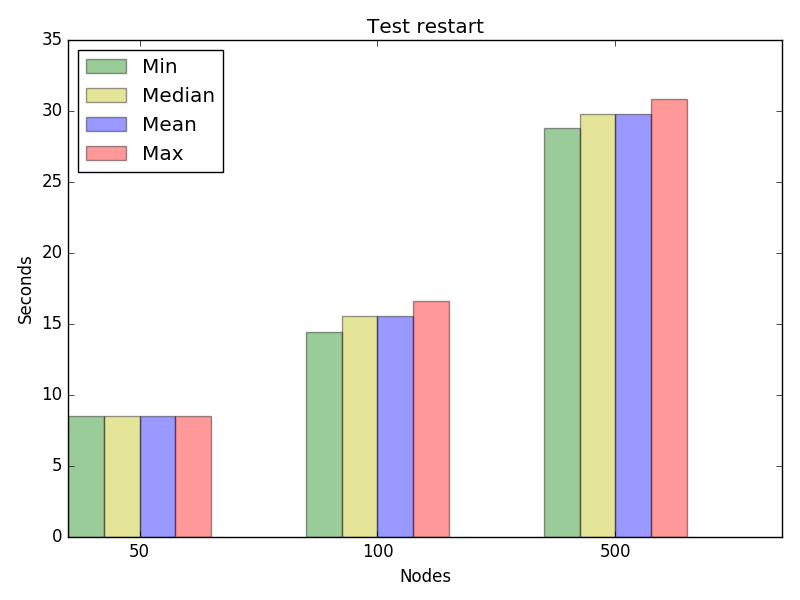
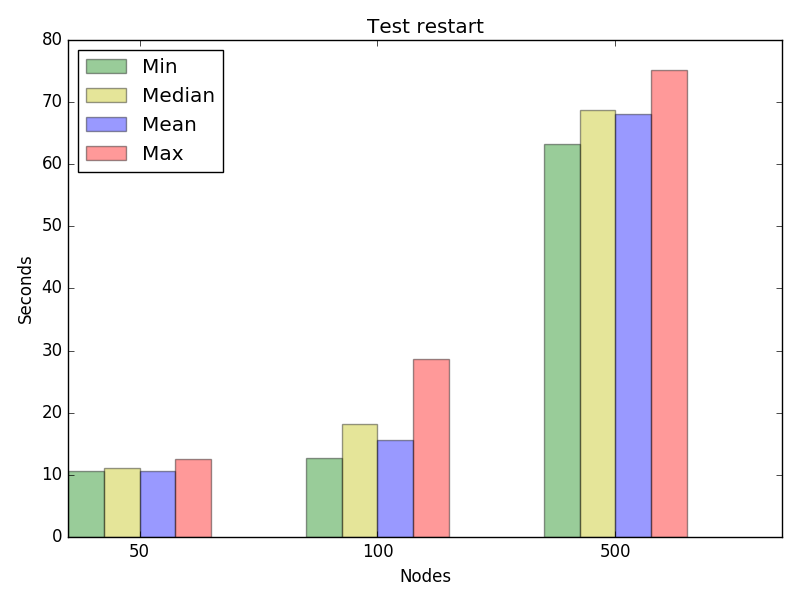
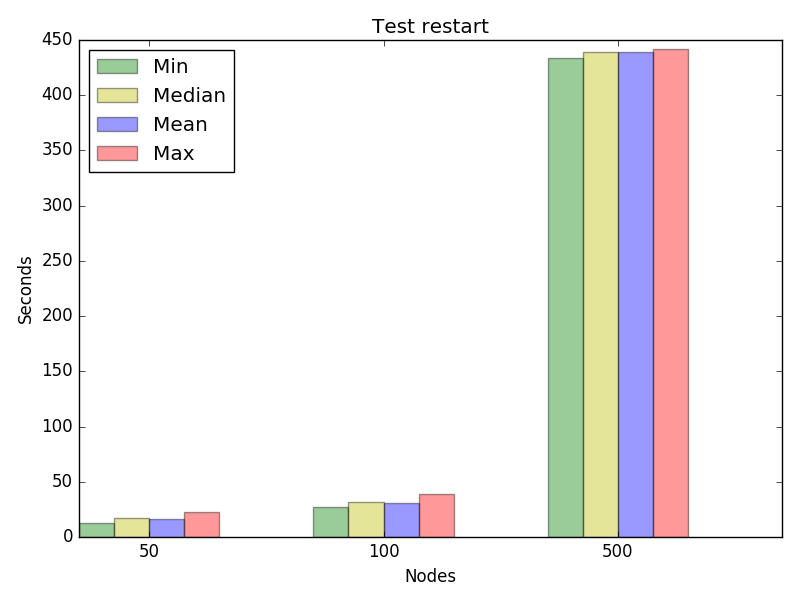
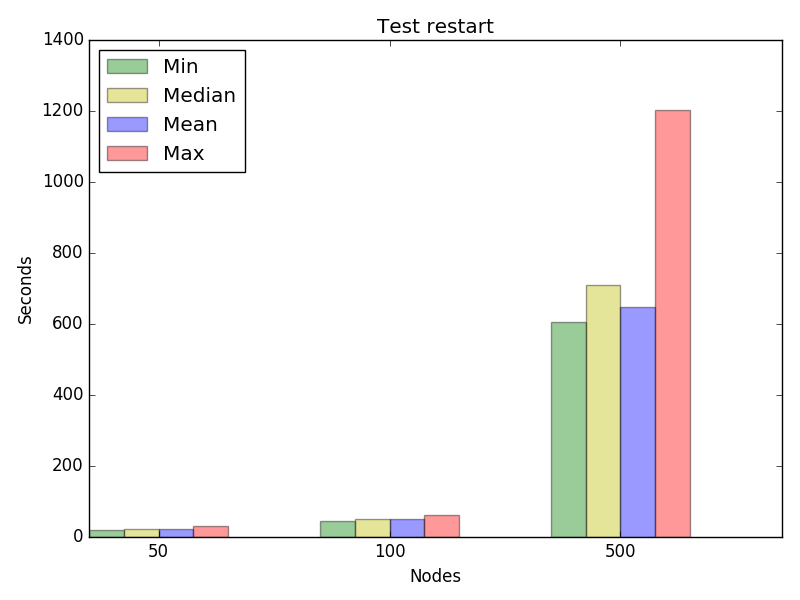
1.2.3. Test restart
| CONCURRENCY | NODES_NUMBER_PER_APPLICATION | APPLICATION_OPERATION (sec) | |||
|---|---|---|---|---|---|
| minimum | maximum | average | median | ||
| 1 | 500 | 28.63 | 28.63 | 28.63 | 28.63 |
| 2 | 50 | 8.51 | 8.53 | 8.52 | 8.52 |
| 2 | 100 | 14.47 | 16.59 | 15.53 | 15.53 |
| 2 | 500 | 28.81 | 30.83 | 29.82 | 29.82 |
| 4 | 50 | 10.56 | 12.53 | 11.07 | 10.59 |
| 4 | 100 | 12.74 | 28.65 | 18.19 | 15.69 |
| 4 | 500 | 63.31 | 75.2 | 68.69 | 68.12 |
| 8 | 50 | 12.75 | 22.68 | 17.18 | 16.64 |
| 8 | 100 | 26.73 | 38.87 | 31.54 | 30.755 |
| 8 | 500 | 433.62 | 441.69 | 439.17 | 439.505 |
| 16 | 50 | 19.36 | 30.86 | 23.32 | 22.73 |
| 16 | 100 | 45.8 | 63.07 | 51.96 | 51.35 |
| 16 | 500 | 605.63 | 1204.02 | 709.46 | 646.73 |
Graph for test restart, concurrency 2
Graph for test restart, concurrency 4
Graph for test restart, concurrency 8
Graph for test restart, concurrency 16
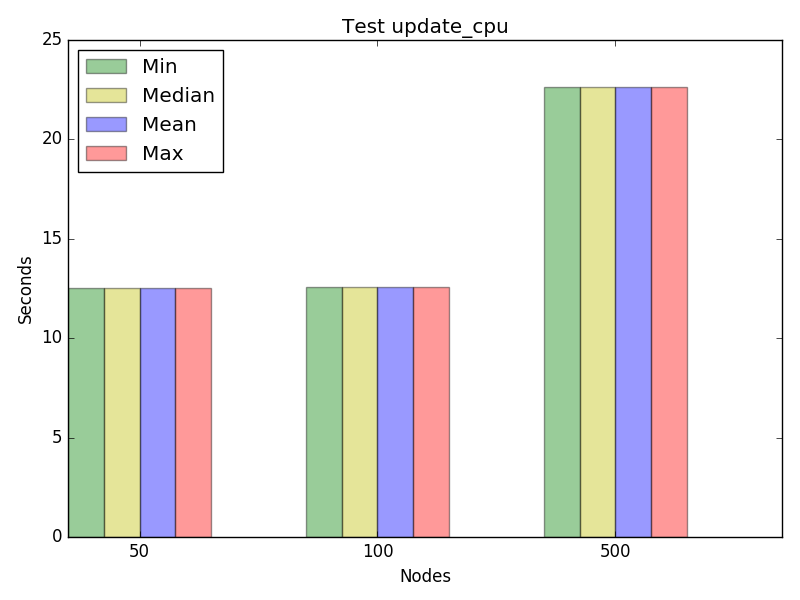
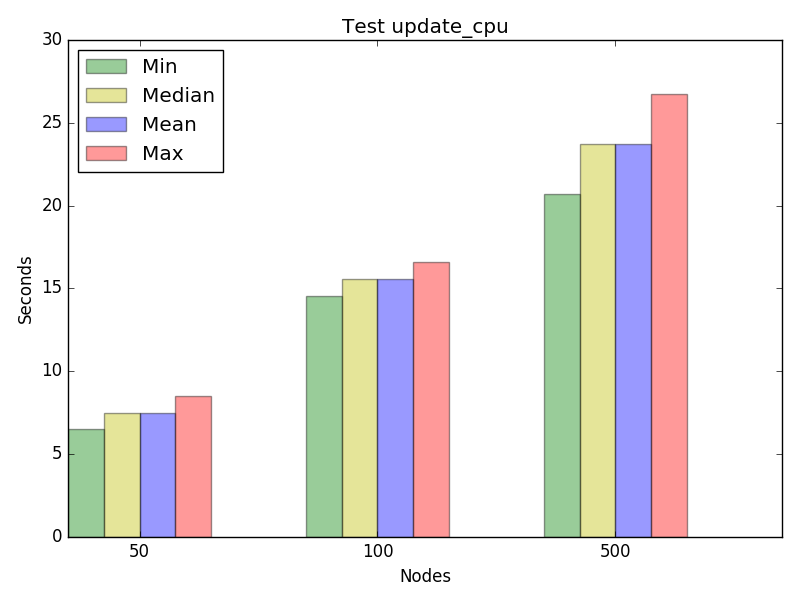
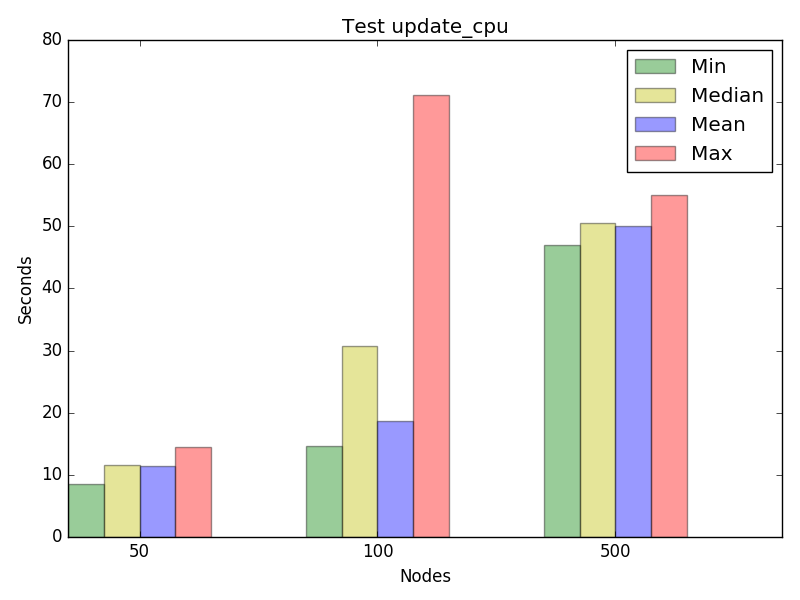
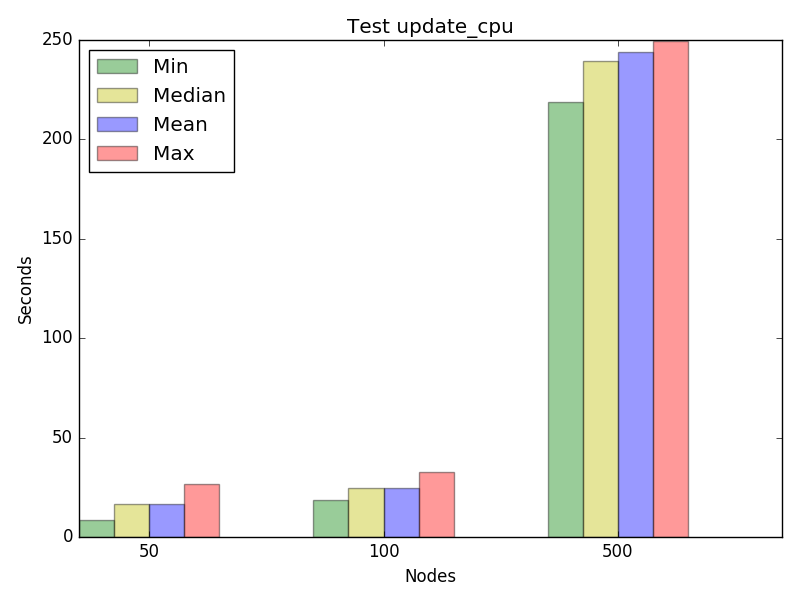
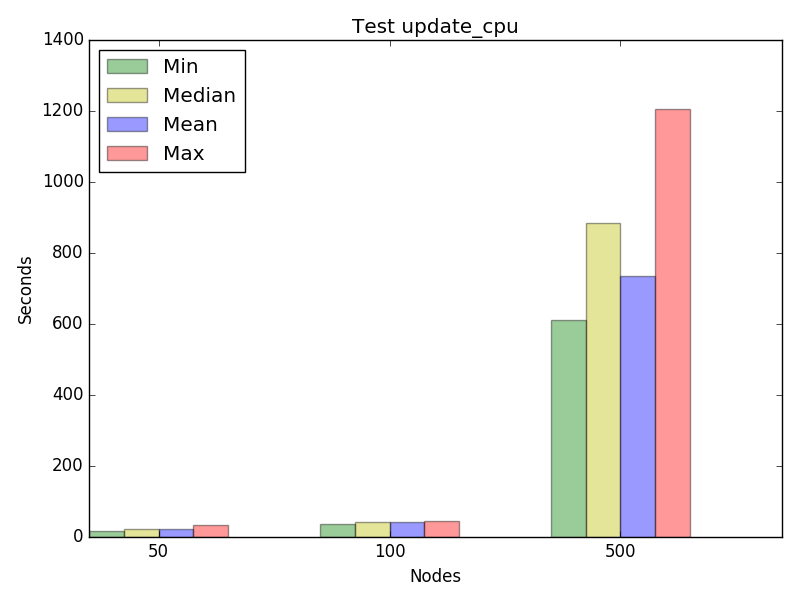
1.2.4. Test update_cpu
| CONCURRENCY | NODES_NUMBER_PER_APPLICATION | APPLICATION_OPERATION (sec) | |||
|---|---|---|---|---|---|
| minimum | maximum | average | median | ||
| 1 | 50 | 12.51 | 12.51 | 12.51 | 12.51 |
| 1 | 100 | 12.56 | 12.56 | 12.56 | 12.56 |
| 1 | 500 | 22.63 | 22.63 | 22.63 | 22.63 |
| 2 | 50 | 6.51 | 8.49 | 7.5 | 7.5 |
| 2 | 100 | 14.53 | 16.58 | 15.55 | 15.555 |
| 2 | 500 | 20.73 | 26.72 | 23.73 | 23.725 |
| 4 | 50 | 8.52 | 14.56 | 11.52 | 11.5 |
| 4 | 100 | 14.6 | 71.14 | 30.77 | 18.67 |
| 4 | 500 | 47.03 | 55.09 | 50.56 | 50.06 |
| 8 | 50 | 8.56 | 26.71 | 16.61 | 16.59 |
| 8 | 100 | 18.65 | 32.73 | 24.67 | 24.655 |
| 8 | 500 | 219.0 | 249.28 | 239.4 | 243.815 |
| 16 | 50 | 16.63 | 32.78 | 22.68 | 22.68 |
| 16 | 100 | 37.56 | 44.87 | 41.58 | 40.95 |
| 16 | 500 | 610.82 | 1205.25 | 883.32 | 736.29 |
Graph for test update_cpu, concurrency 1
Graph for test update_cpu, concurrency 2
Graph for test update_cpu, concurrency 4
Graph for test update_cpu, concurrency 8
Graph for test update_cpu, concurrency 16
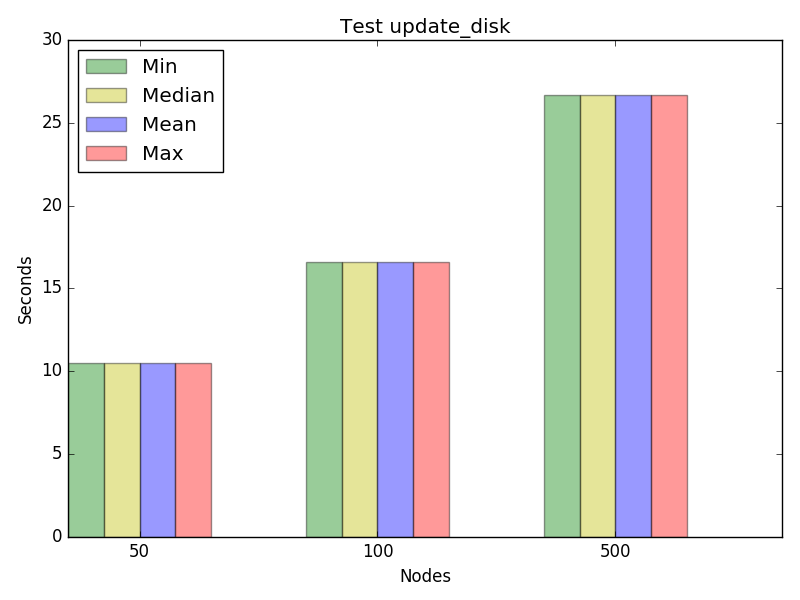
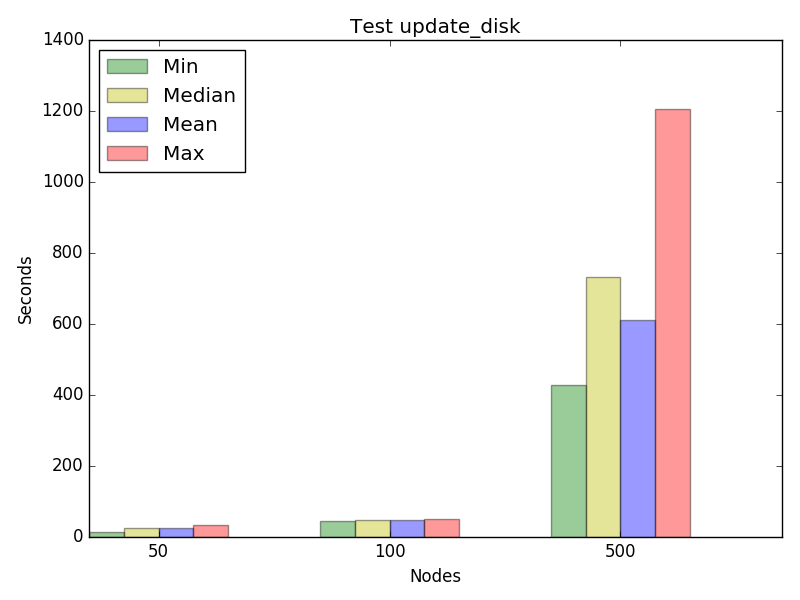
1.2.5. Test update_disk
| CONCURRENCY | NODES_NUMBER_PER_APPLICATION | APPLICATION_OPERATION (sec) | |||
|---|---|---|---|---|---|
| minimum | maximum | average | median | ||
| 1 | 50 | 10.48 | 10.48 | 10.48 | 10.48 |
| 1 | 100 | 16.59 | 16.59 | 16.59 | 16.59 |
| 1 | 500 | 26.65 | 26.65 | 26.65 | 26.65 |
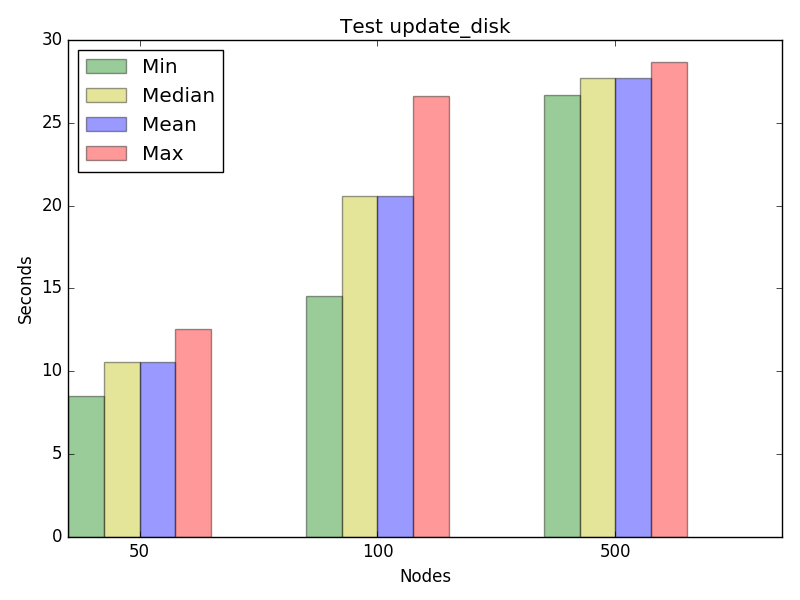
| 2 | 50 | 8.52 | 12.56 | 10.54 | 10.54 |
| 2 | 100 | 14.56 | 26.61 | 20.59 | 20.585 |
| 2 | 500 | 26.67 | 28.68 | 27.68 | 27.675 |
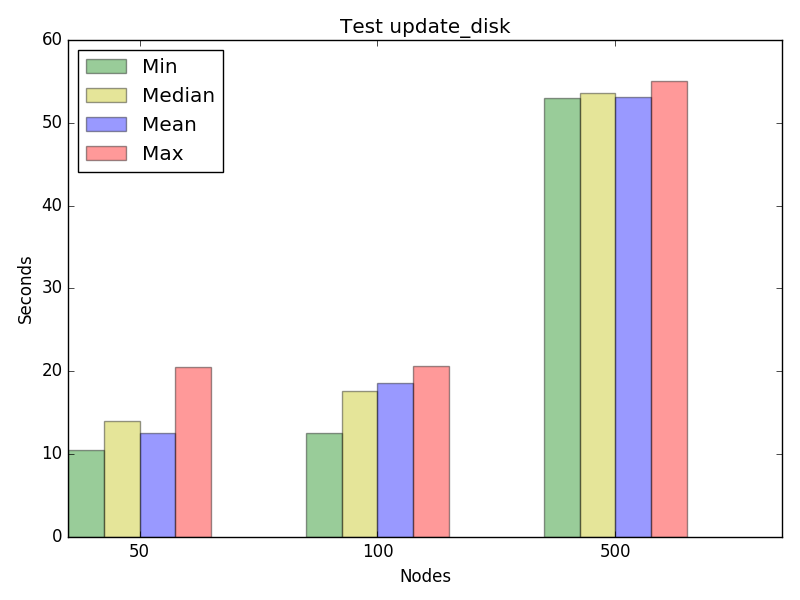
| 4 | 50 | 10.56 | 20.55 | 14.05 | 12.555 |
| 4 | 100 | 12.59 | 20.63 | 17.6 | 18.59 |
| 4 | 500 | 53.01 | 55.1 | 53.58 | 53.1 |
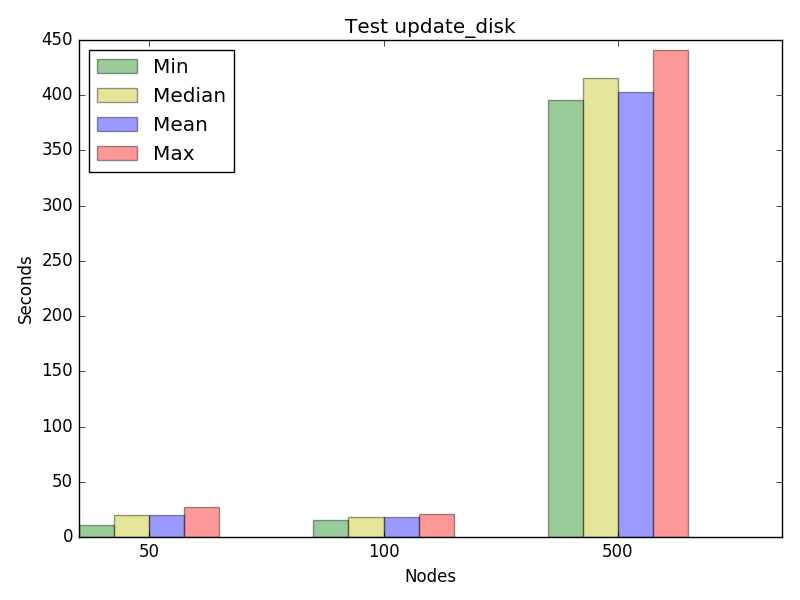
| 8 | 50 | 10.67 | 26.75 | 19.66 | 19.635 |
| 8 | 100 | 15.18 | 20.68 | 17.99 | 17.705 |
| 8 | 500 | 395.82 | 441.34 | 415.5 | 402.97 |
| 16 | 50 | 15.0 | 32.79 | 24.62 | 24.705 |
| 16 | 100 | 44.19 | 50.94 | 47.14 | 46.995 |
| 16 | 500 | 426.87 | 1204.53 | 731.92 | 610.83 |
Graph for test update_disk, concurrency 1
Graph for test update_disk, concurrency 2
Graph for test update_disk, concurrency 4
Graph for test update_disk, concurrency 8
Graph for test update_disk, concurrency 16
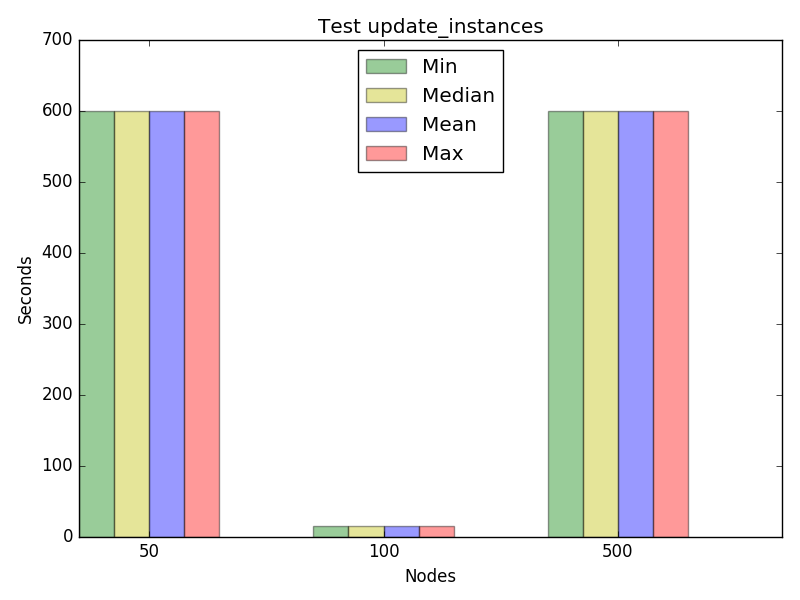
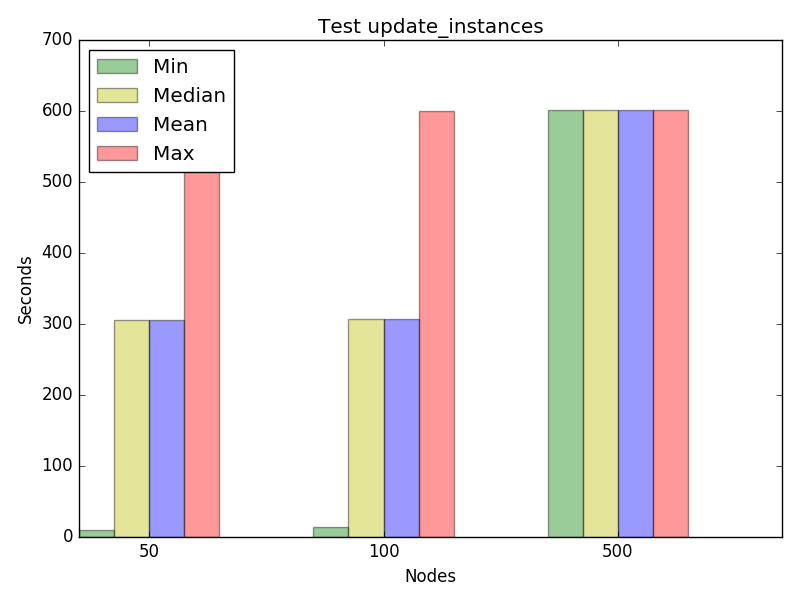
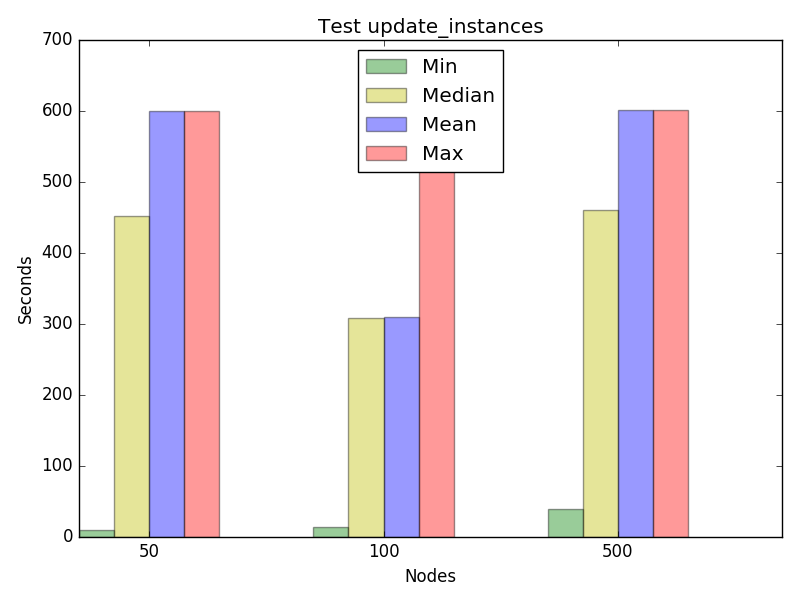
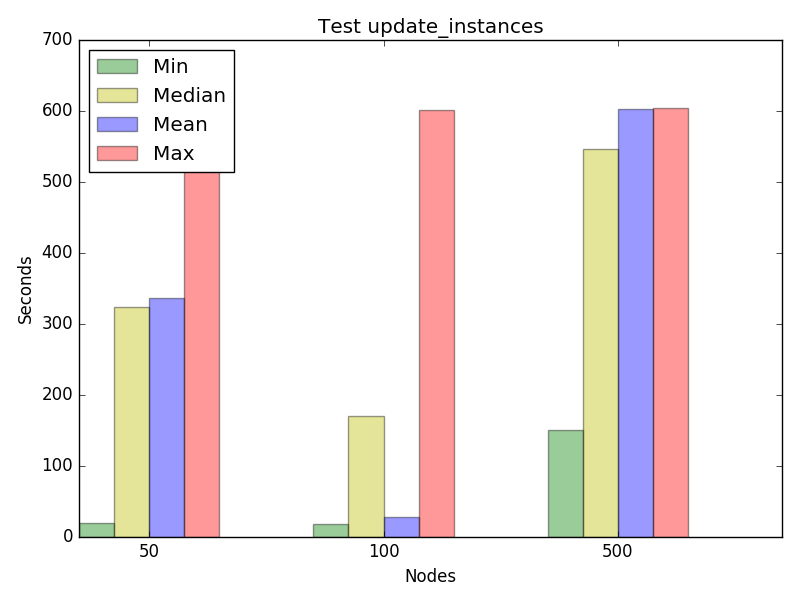
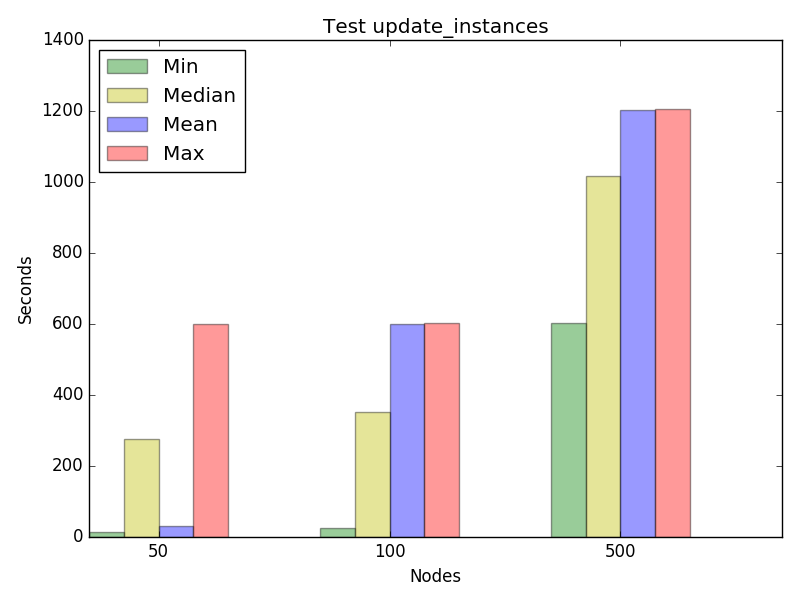
1.2.6. Test update_instances
| CONCURRENCY | NODES_NUMBER_PER_APPLICATION | APPLICATION_OPERATION (sec) | |||
|---|---|---|---|---|---|
| minimum | maximum | average | median | ||
| 1 | 50 | 600.05 | 600.05 | 600.05 | 600.05 |
| 1 | 100 | 16.17 | 16.17 | 16.17 | 16.17 |
| 1 | 500 | 600.31 | 600.31 | 600.31 | 600.31 |
| 2 | 50 | 10.12 | 600.11 | 305.12 | 305.115 |
| 2 | 100 | 14.16 | 600.19 | 307.18 | 307.175 |
| 2 | 500 | 600.72 | 601.09 | 600.9 | 600.905 |
| 4 | 50 | 10.13 | 600.17 | 452.65 | 600.155 |
| 4 | 100 | 14.18 | 600.36 | 308.75 | 310.225 |
| 4 | 500 | 39.4 | 602.01 | 461.02 | 601.33 |
| 8 | 50 | 20.24 | 600.4 | 323.46 | 336.595 |
| 8 | 100 | 18.23 | 600.79 | 169.8 | 28.68 |
| 8 | 500 | 150.94 | 603.91 | 546.72 | 603.255 |
| 16 | 50 | 14.25 | 600.72 | 276.17 | 32.375 |
| 16 | 100 | 24.24 | 601.53 | 351.71 | 601.0 |
| 16 | 500 | 603.1 | 1206.38 | 1016.9 | 1203.81 |
Graph for test update_instances, concurrency 1
Graph for test update_instances, concurrency 2
Graph for test update_instances, concurrency 4
Graph for test update_instances, concurrency 8
Graph for test update_instances, concurrency 16
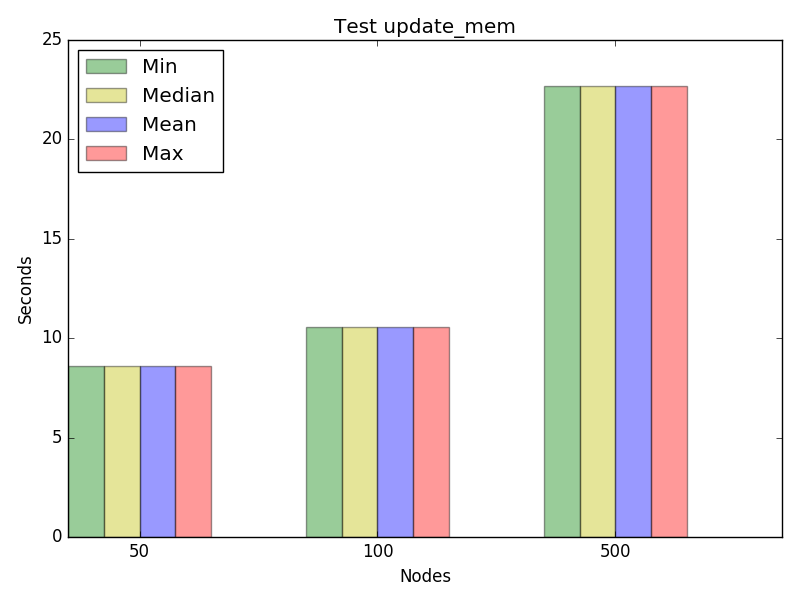
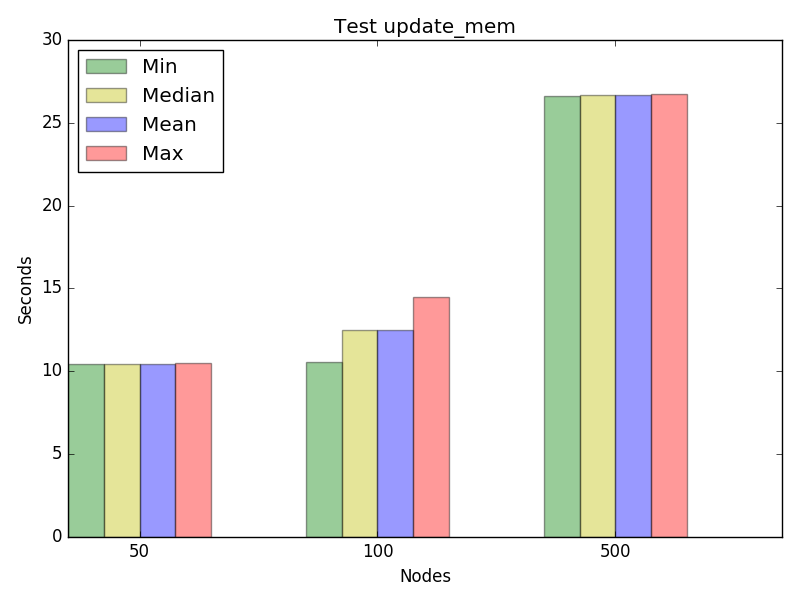
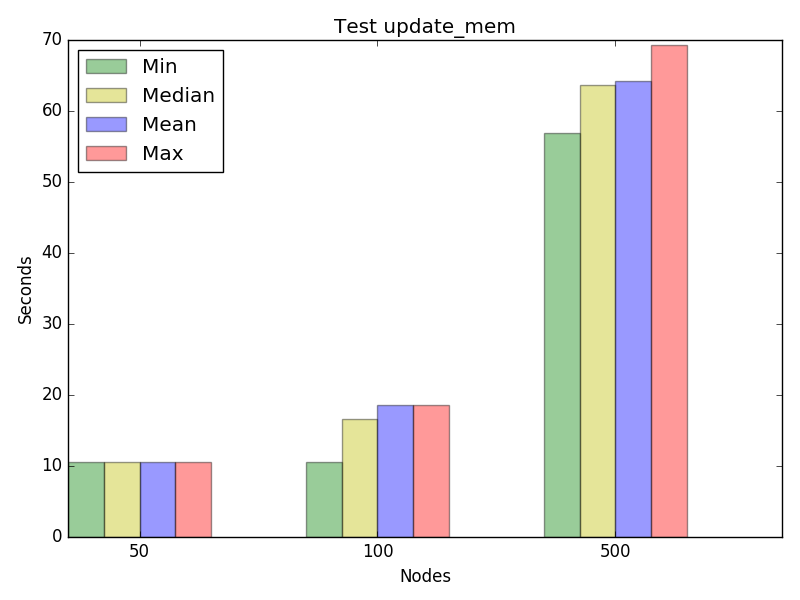
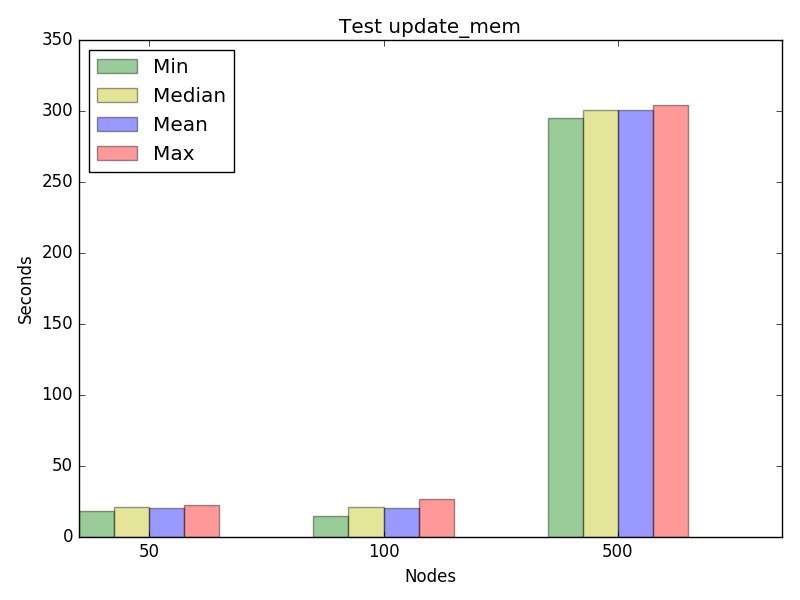
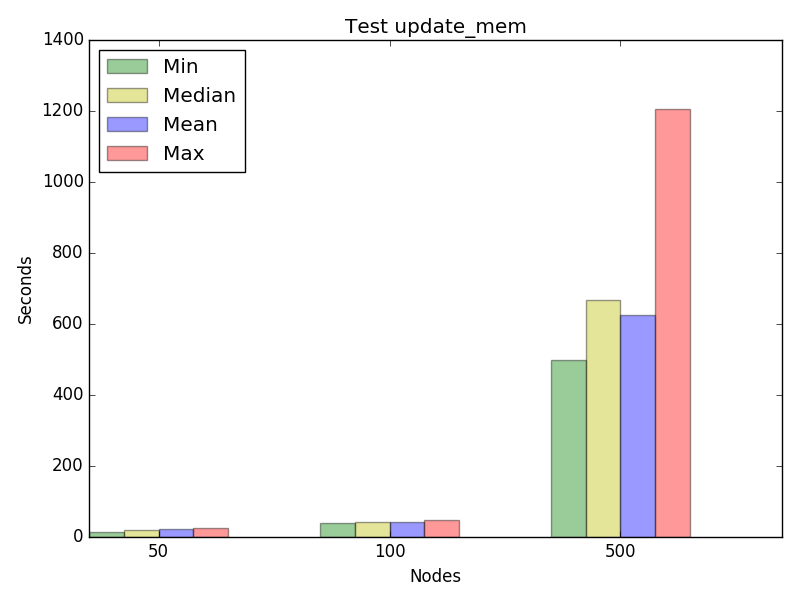
1.2.7. Test update_mem
| CONCURRENCY | NODES_NUMBER_PER_APPLICATION | APPLICATION_OPERATION (sec) | |||
|---|---|---|---|---|---|
| minimum | maximum | average | median | ||
| 1 | 50 | 8.58 | 8.58 | 8.58 | 8.58 |
| 1 | 100 | 10.55 | 10.55 | 10.55 | 10.55 |
| 1 | 500 | 22.68 | 22.68 | 22.68 | 22.68 |
| 2 | 50 | 10.46 | 10.48 | 10.47 | 10.47 |
| 2 | 100 | 10.54 | 14.5 | 12.52 | 12.52 |
| 2 | 500 | 26.6 | 26.76 | 26.68 | 26.68 |
| 4 | 50 | 10.51 | 10.55 | 10.54 | 10.54 |
| 4 | 100 | 10.57 | 18.65 | 16.59 | 18.575 |
| 4 | 500 | 56.96 | 69.29 | 63.66 | 64.2 |
| 8 | 50 | 18.61 | 22.74 | 21.16 | 20.695 |
| 8 | 100 | 15.1 | 26.77 | 21.26 | 20.7 |
| 8 | 500 | 294.84 | 304.16 | 300.42 | 300.86 |
| 16 | 50 | 13.92 | 24.67 | 19.78 | 21.645 |
| 16 | 100 | 39.57 | 49.03 | 41.95 | 41.24 |
| 16 | 500 | 498.57 | 1204.44 | 666.49 | 624.195 |
Graph for test update_mem, concurrency 1
Graph for test update_mem, concurrency 2
Graph for test update_mem, concurrency 4
Graph for test update_mem, concurrency 8
Graph for test update_mem, concurrency 16
1.2.8. Test health check
| CONTAINERS_COUNT | HEALTH_CHECK_INTERVAL_DEVIATION (sec) | |||
|---|---|---|---|---|
| minimum | maximum | average | 95% | |
| 2500 | 0.00 | 0.12 | 0.02 | 0.04 |