Kubernetes proxy performance test report
- Abstract
This document is the report for Kubernetes proxy performance test plan
Environment description
This report is collected on the hardware described in Intel-Mirantis Performance-Team Lab #1.
Software
Kubernetes is installed using Kargo deployment tool on Ubuntu 16.04.1.
- Node roles:
node1: minion+master+etcd
node2: minion+master+etcd
node3: minion+etcd
node4: minion
node5: minion
node6: minion
- Software versions:
OS: Ubuntu 16.04.1 LTS (Xenial Xerus)
Kernel: 4.4.0-47-generic
Docker: 1.13.0
Kubernetes: v1.5.3+coreos.0
Reports
Test Case #1: Performing kube-proxy
Launched script that adds 100 services
Detailed Stats
Case group 1
Note: You can download these reports in csv format
here
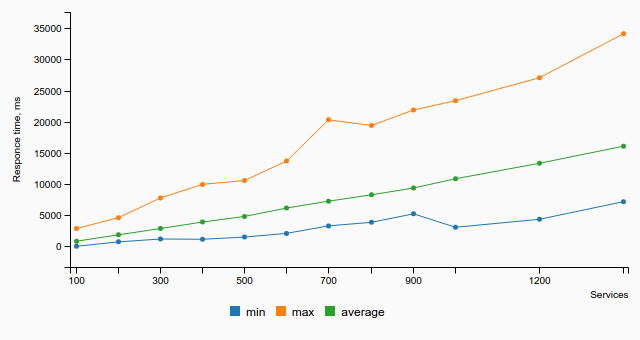
SERVICE_COUNT |
MIN_RESPONCE, ms |
AVERAGE_RESPONSE, ms |
MAX_RESPONSE, ms |
|---|---|---|---|
100 |
12 |
821 |
2854 |
200 |
717 |
1843 |
4599 |
300 |
1173 |
2859 |
7773 |
400 |
1132 |
3898 |
9939 |
500 |
1483 |
4794 |
10567 |
600 |
2077 |
6139 |
13680 |
700 |
3280 |
7246 |
20293 |
800 |
3853 |
8268 |
19396 |
900 |
5216 |
9357 |
21877 |
1000 |
3056 |
10844 |
23374 |
1200 |
4339 |
13327 |
27060 |
1400 |
7168 |
16072 |
34114 |
Case group 2
Note: The dependence of the time response from number of pods.
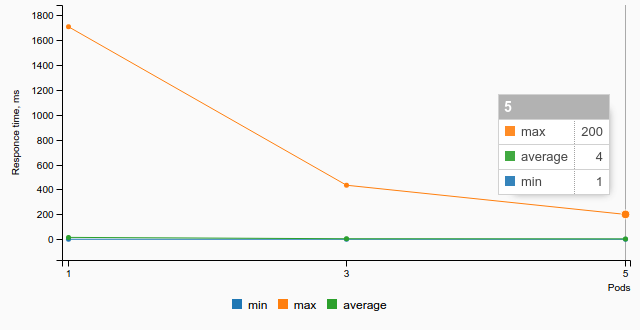
POD_COUNT |
MIN_RESPONCE, ms |
AVERAGE_RESPONSE, ms |
MAX_RESPONSE, ms |
|---|---|---|---|
1 |
1 |
16 |
1704 |
3 |
1 |
5 |
434 |
5 |
1 |
4 |
200 |
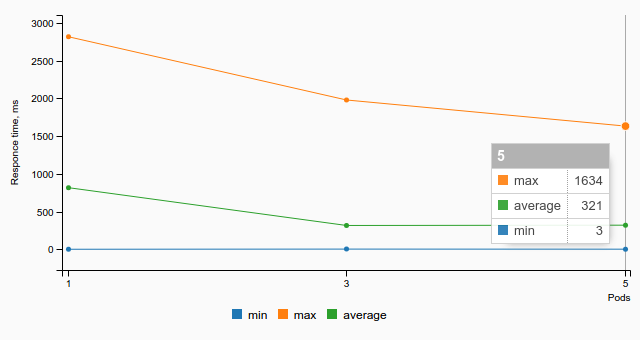
POD_COUNT |
MIN_RESPONCE, ms |
AVERAGE_RESPONSE, ms |
MAX_RESPONSE, ms |
|---|---|---|---|
1 |
2 |
818 |
2818 |
3 |
4 |
317 |
1980 |
5 |
3 |
321 |
1634 |
