Vitrage Use Cases
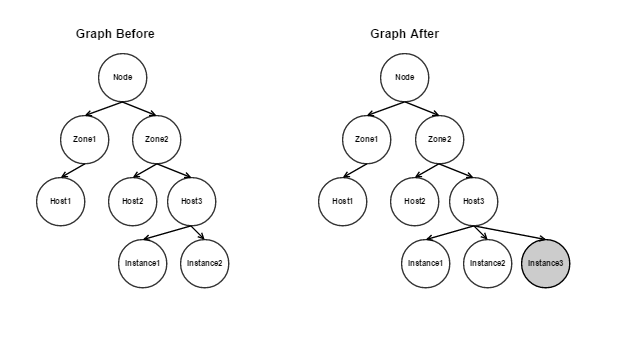
Add Nova Instance
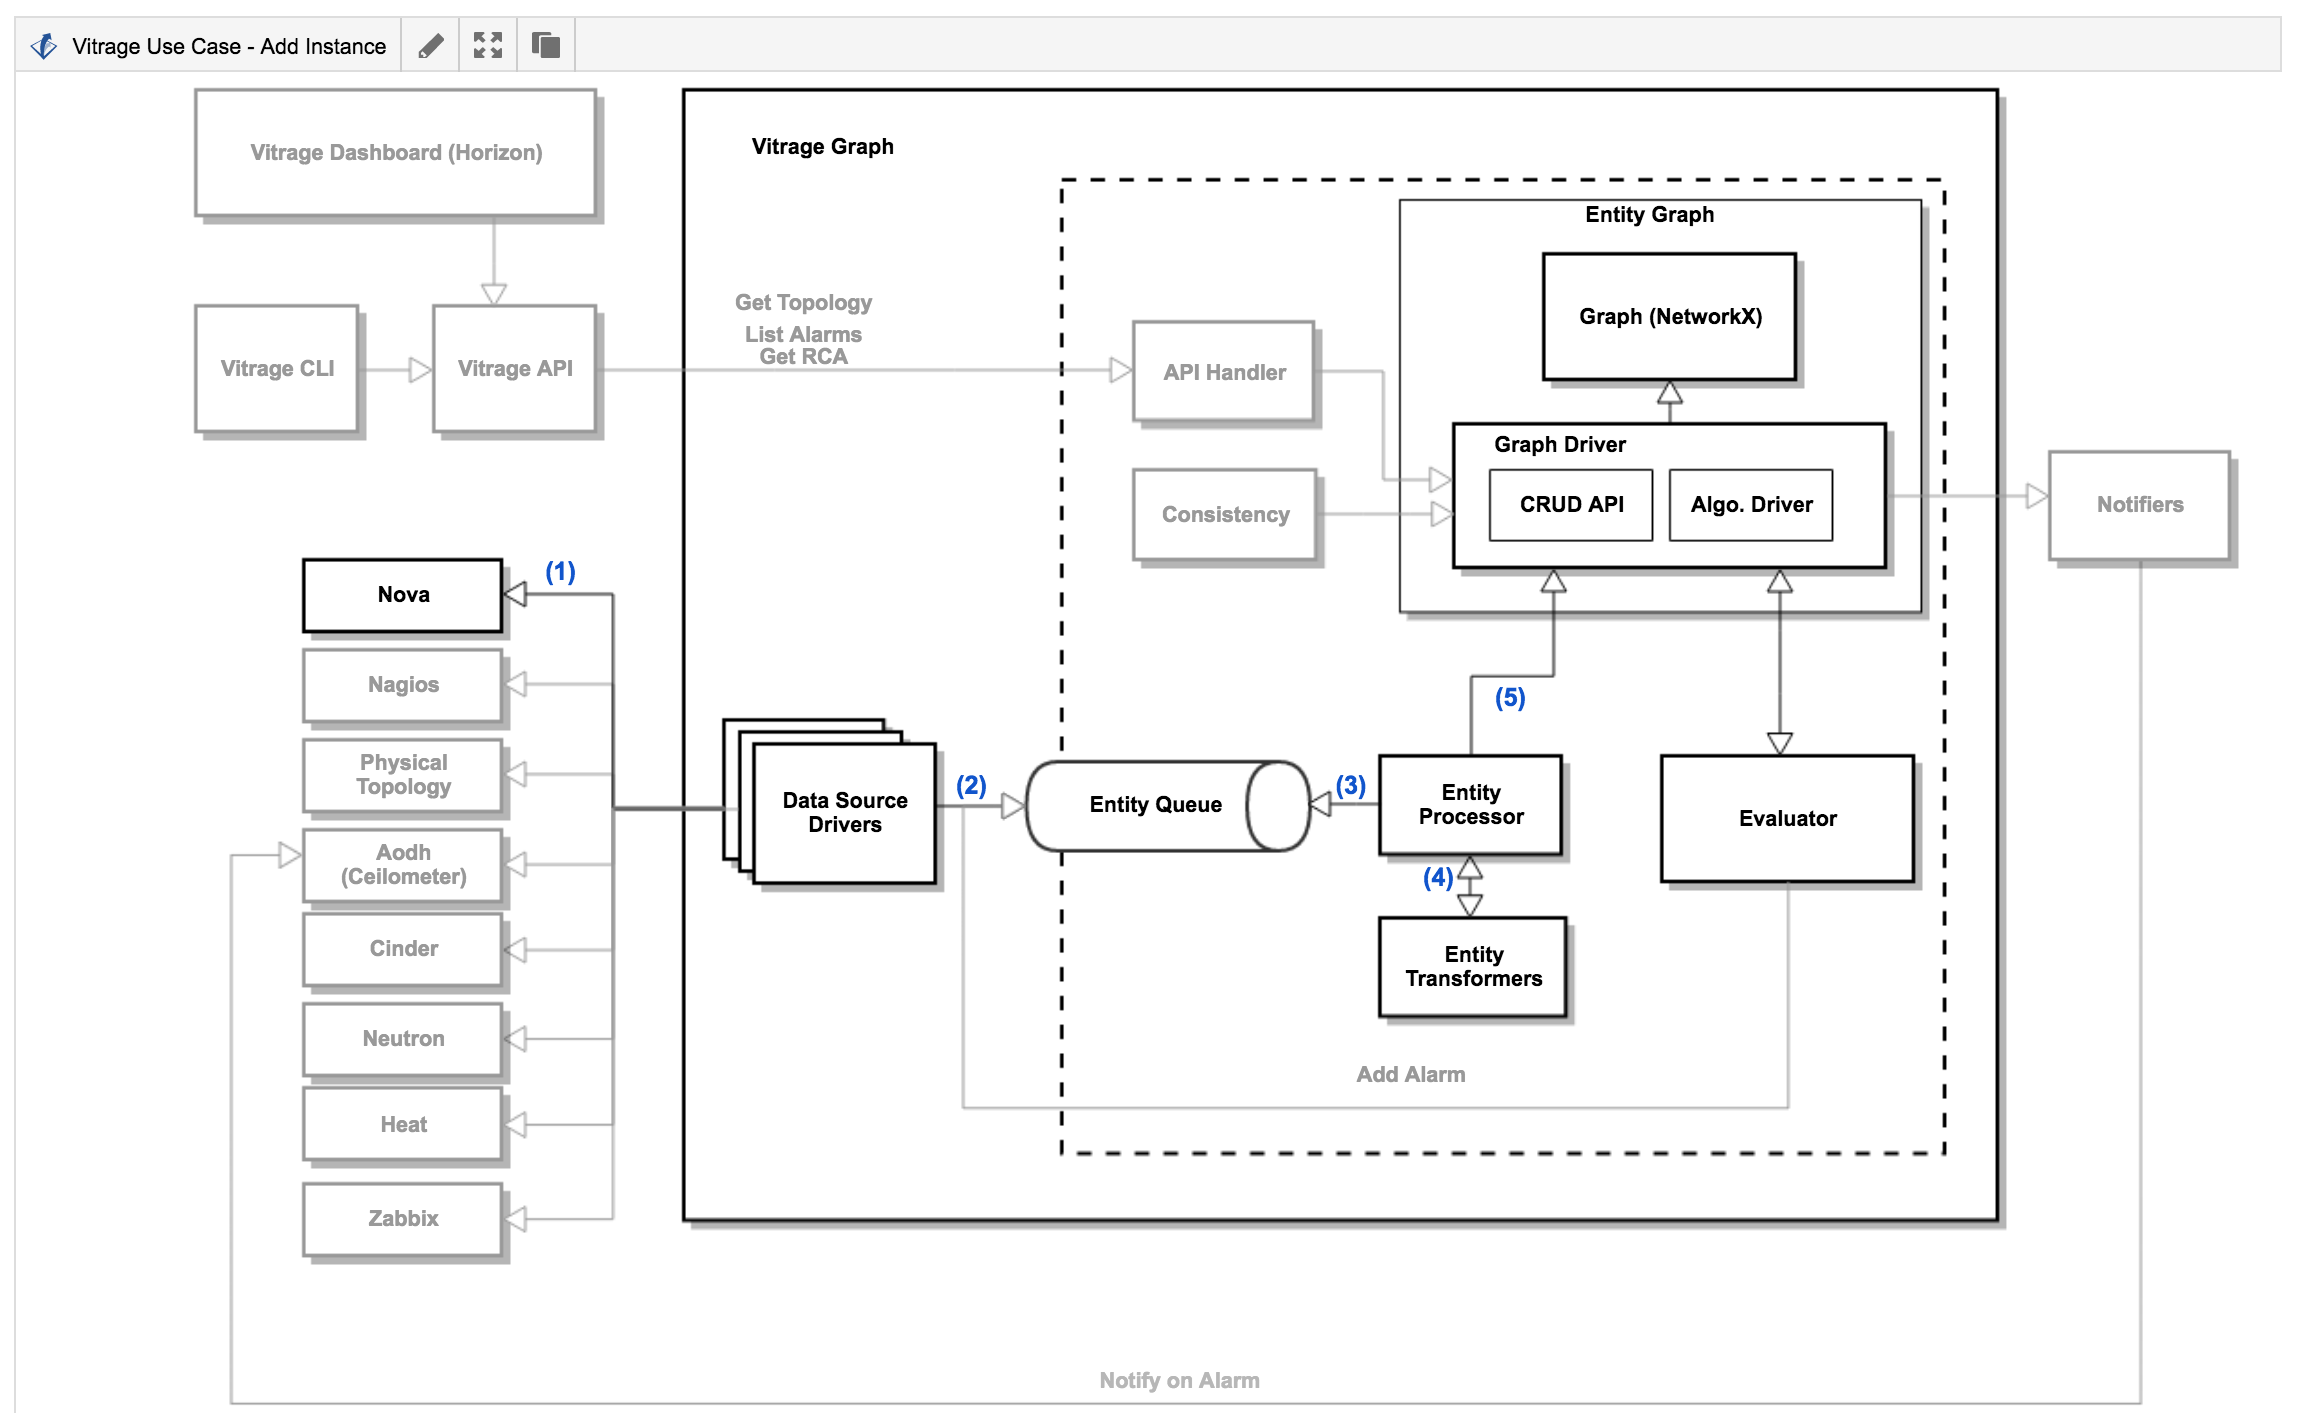
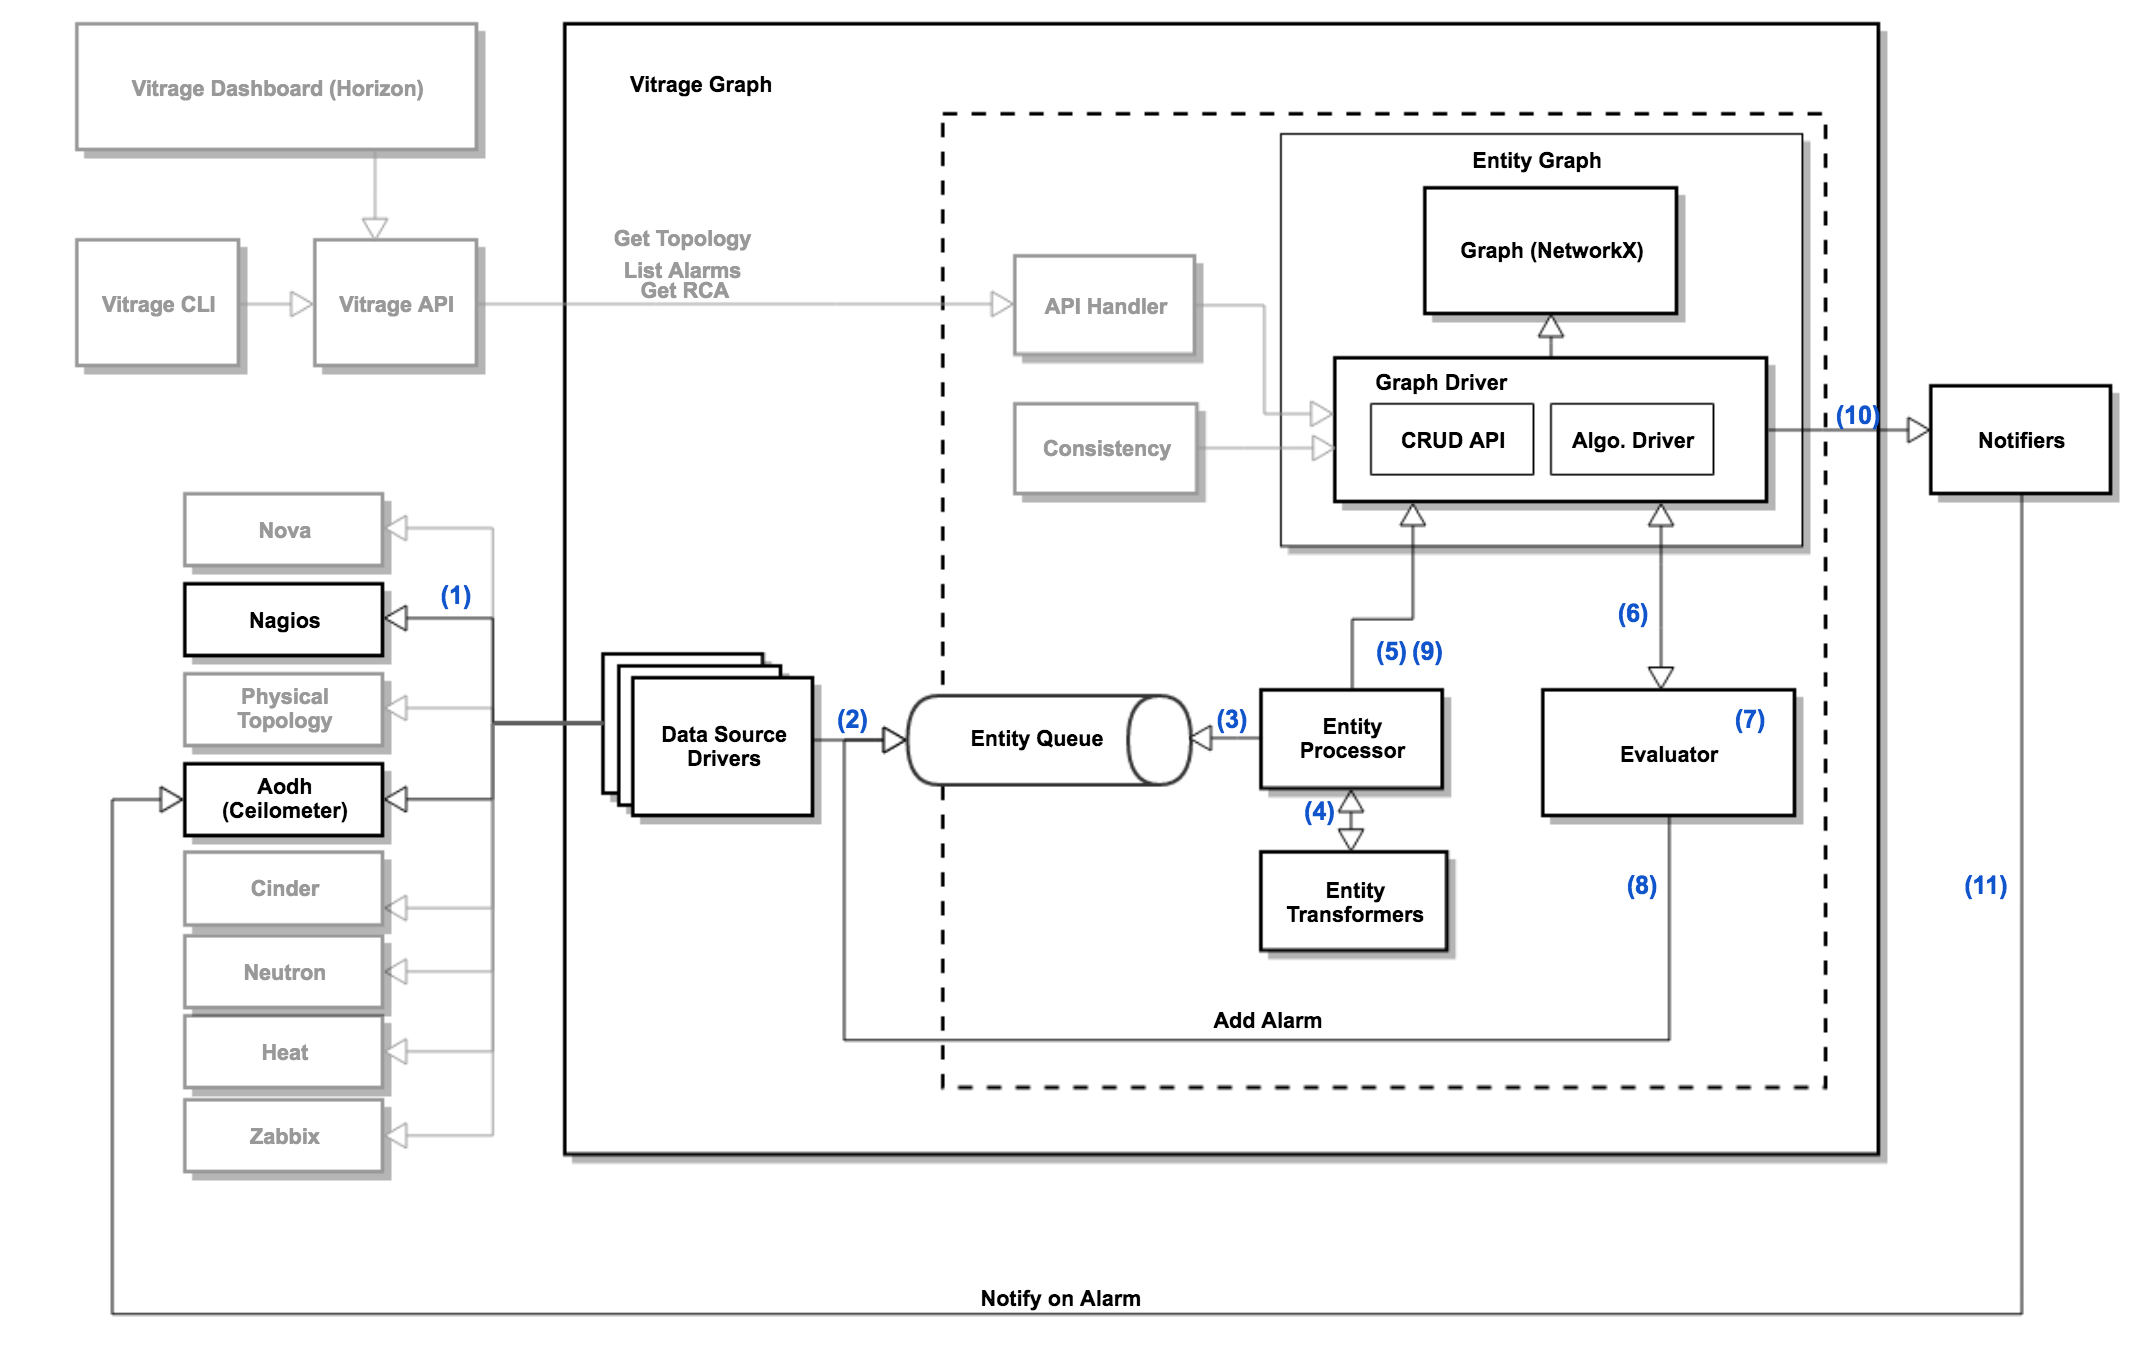
Nova datasource Driver queries all Nova instances, or gets a message bus notification about a new Nova instance
Nova datasource Driver sends corresponding events to the Entity Queue
The Entity Processor polls the Entity Queue and gets the new Nova Instance event
The Entity Processor passes the event to the Nova Instance Transformer, which returns a Vertex with the instance data, with an edge to the host Vertex in the graph
The Entity Processor adds the new vertex and edge to the Graph
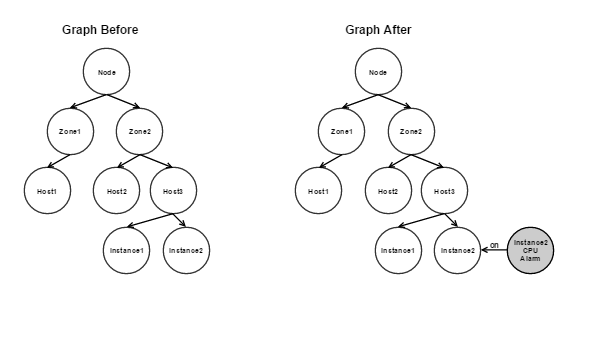
Add Aodh Alarm
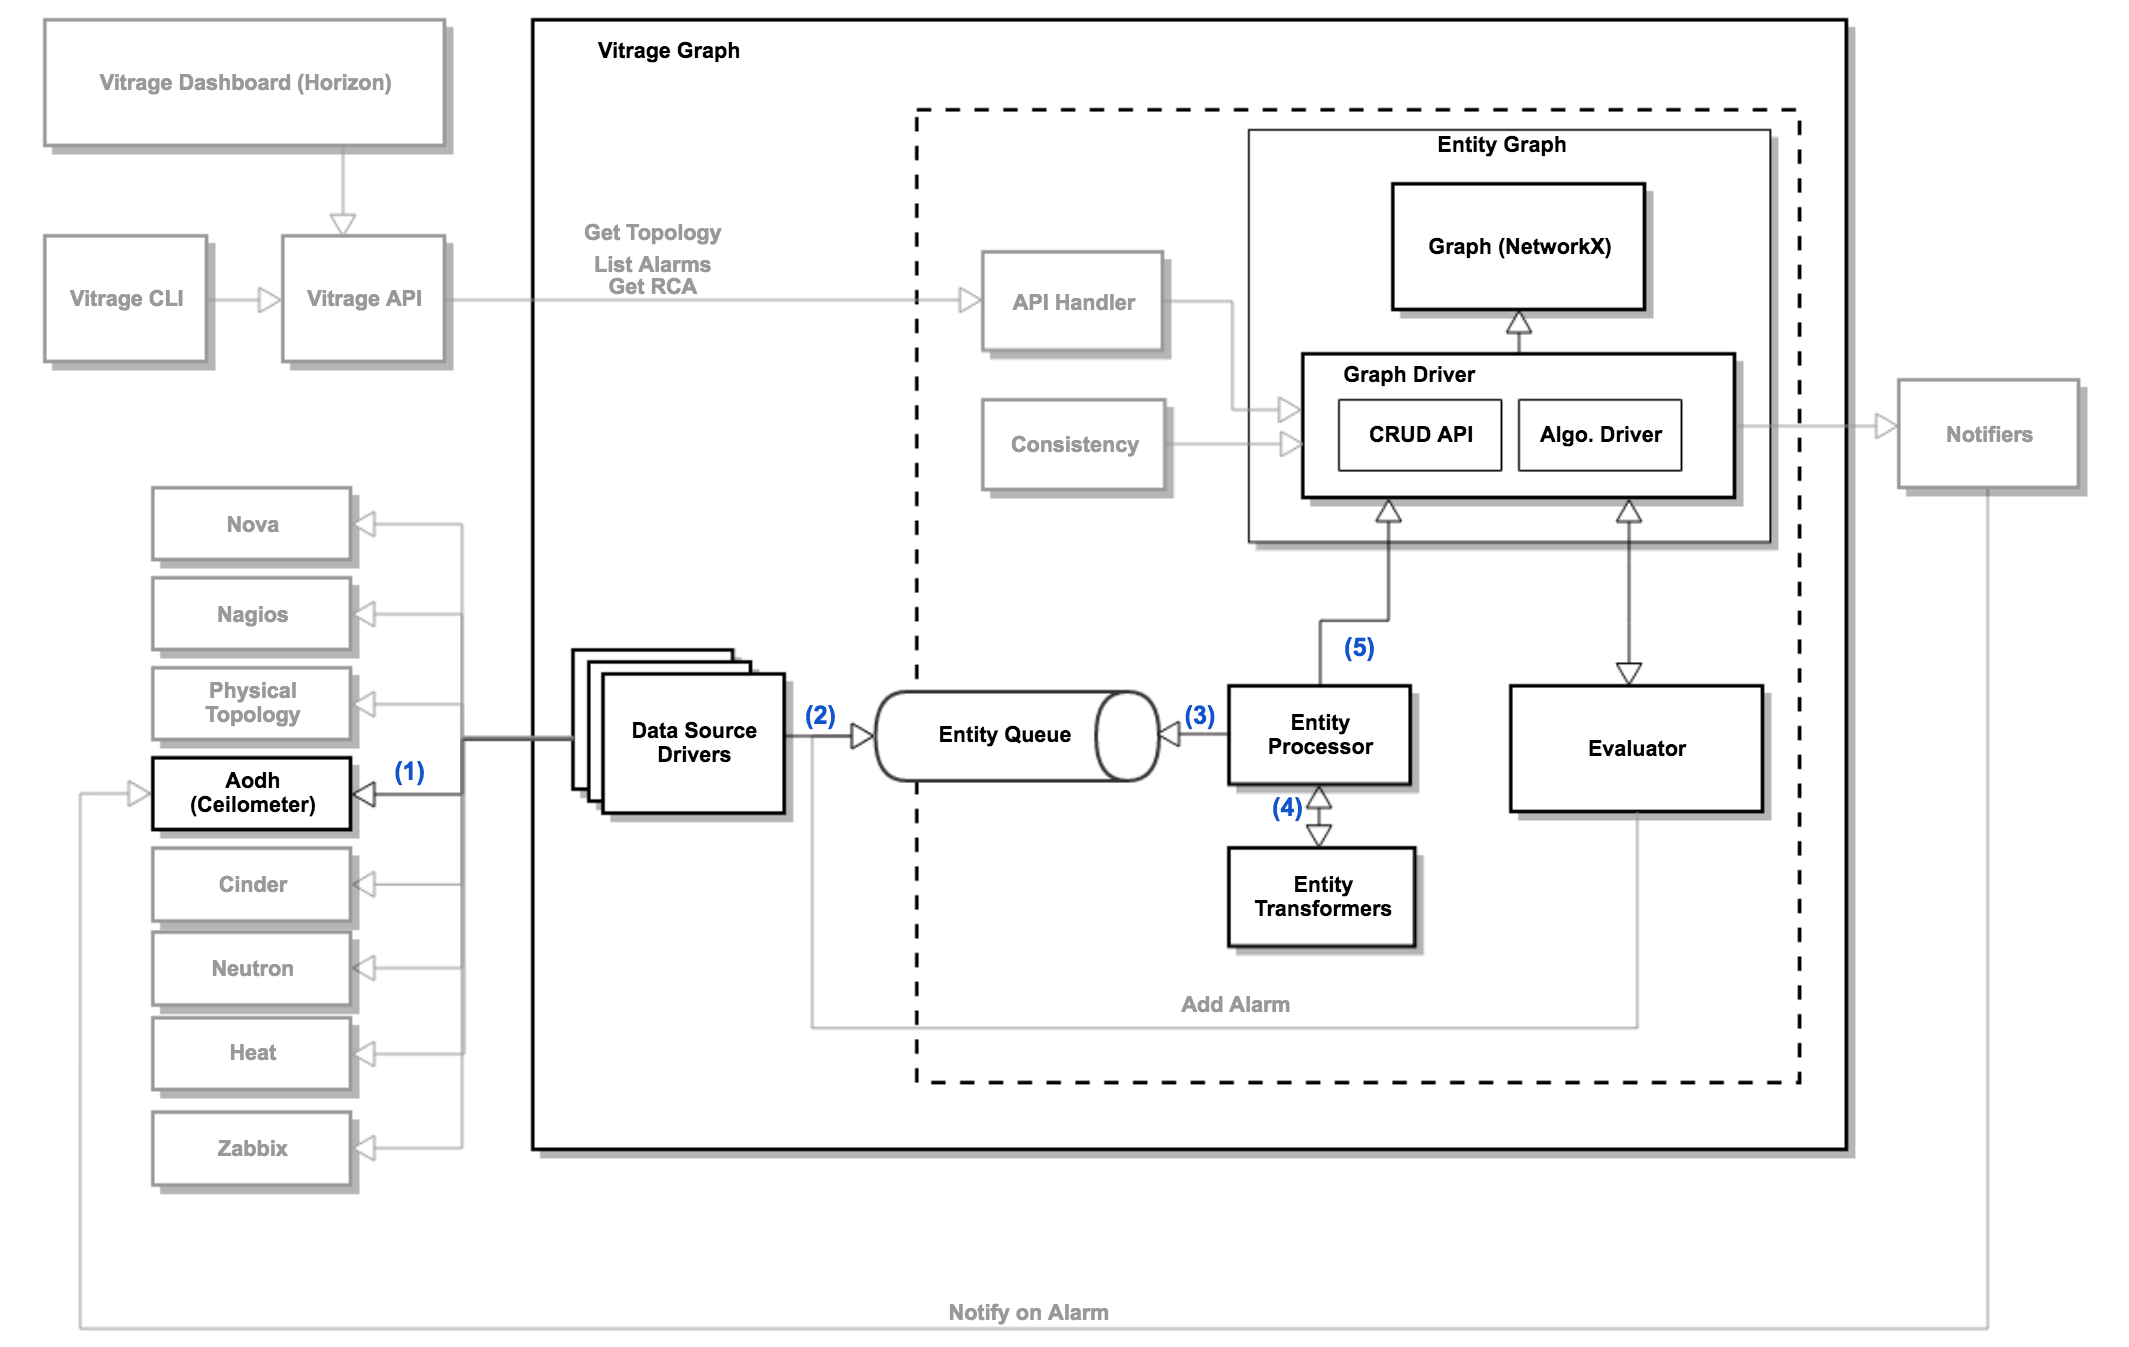
Aodh Driver queries all Aodh alarms
Aodh Driver sends corresponding events to the Entity Queue
The Entity Processor polls the Entity Queue and gets the Aodh Alarm event, for example threshold alarm on Instance-1 CPU
The Entity Processor passes the event to the Aodh Alarm Transformer, which returns a Vertex with the alarm data, with an edge to the instance Vertex
The Entity Processor adds the new vertex and edge to the Graph
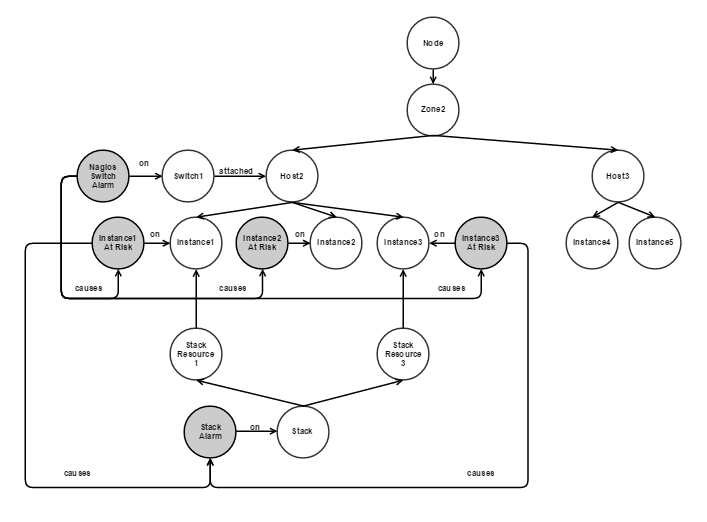
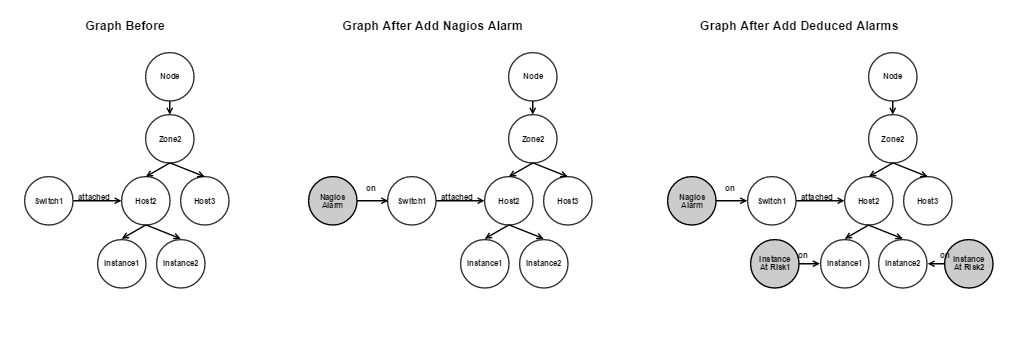
Nagios Alarm Causes Deduced Alarm
(steps 1-4) Nagios datasource driver pushes a nagios alarm on a switch to the Entity Queue, which is converted by Nagios Transformer to a vertex and inserted to the Graph
The Evaluator is notified about a new Vertex (Nagios switch alarm) that was added to the graph
The Evaluator performs its calculations and deduces that alarms should be triggered on every instance on every host attached to this switch
The Evaluator pushes alarms to the Entity Queue
The graph is updated with these new alarms
The graph writes to the message bus that new alarms were created
Aodh Notifier creates new alarm definitions in Aodh, and sets their states to “alarm”
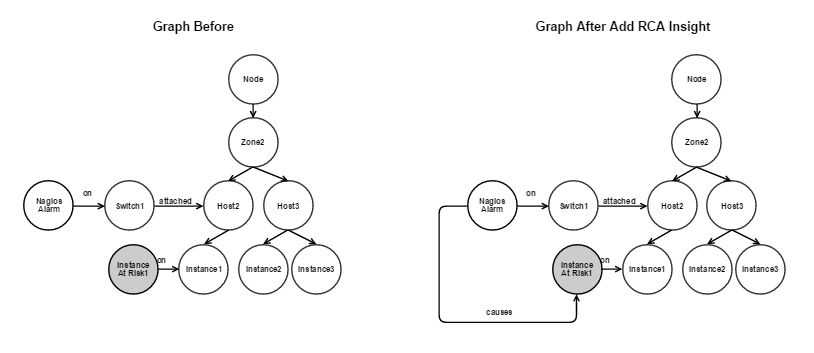
Create RCA Insights
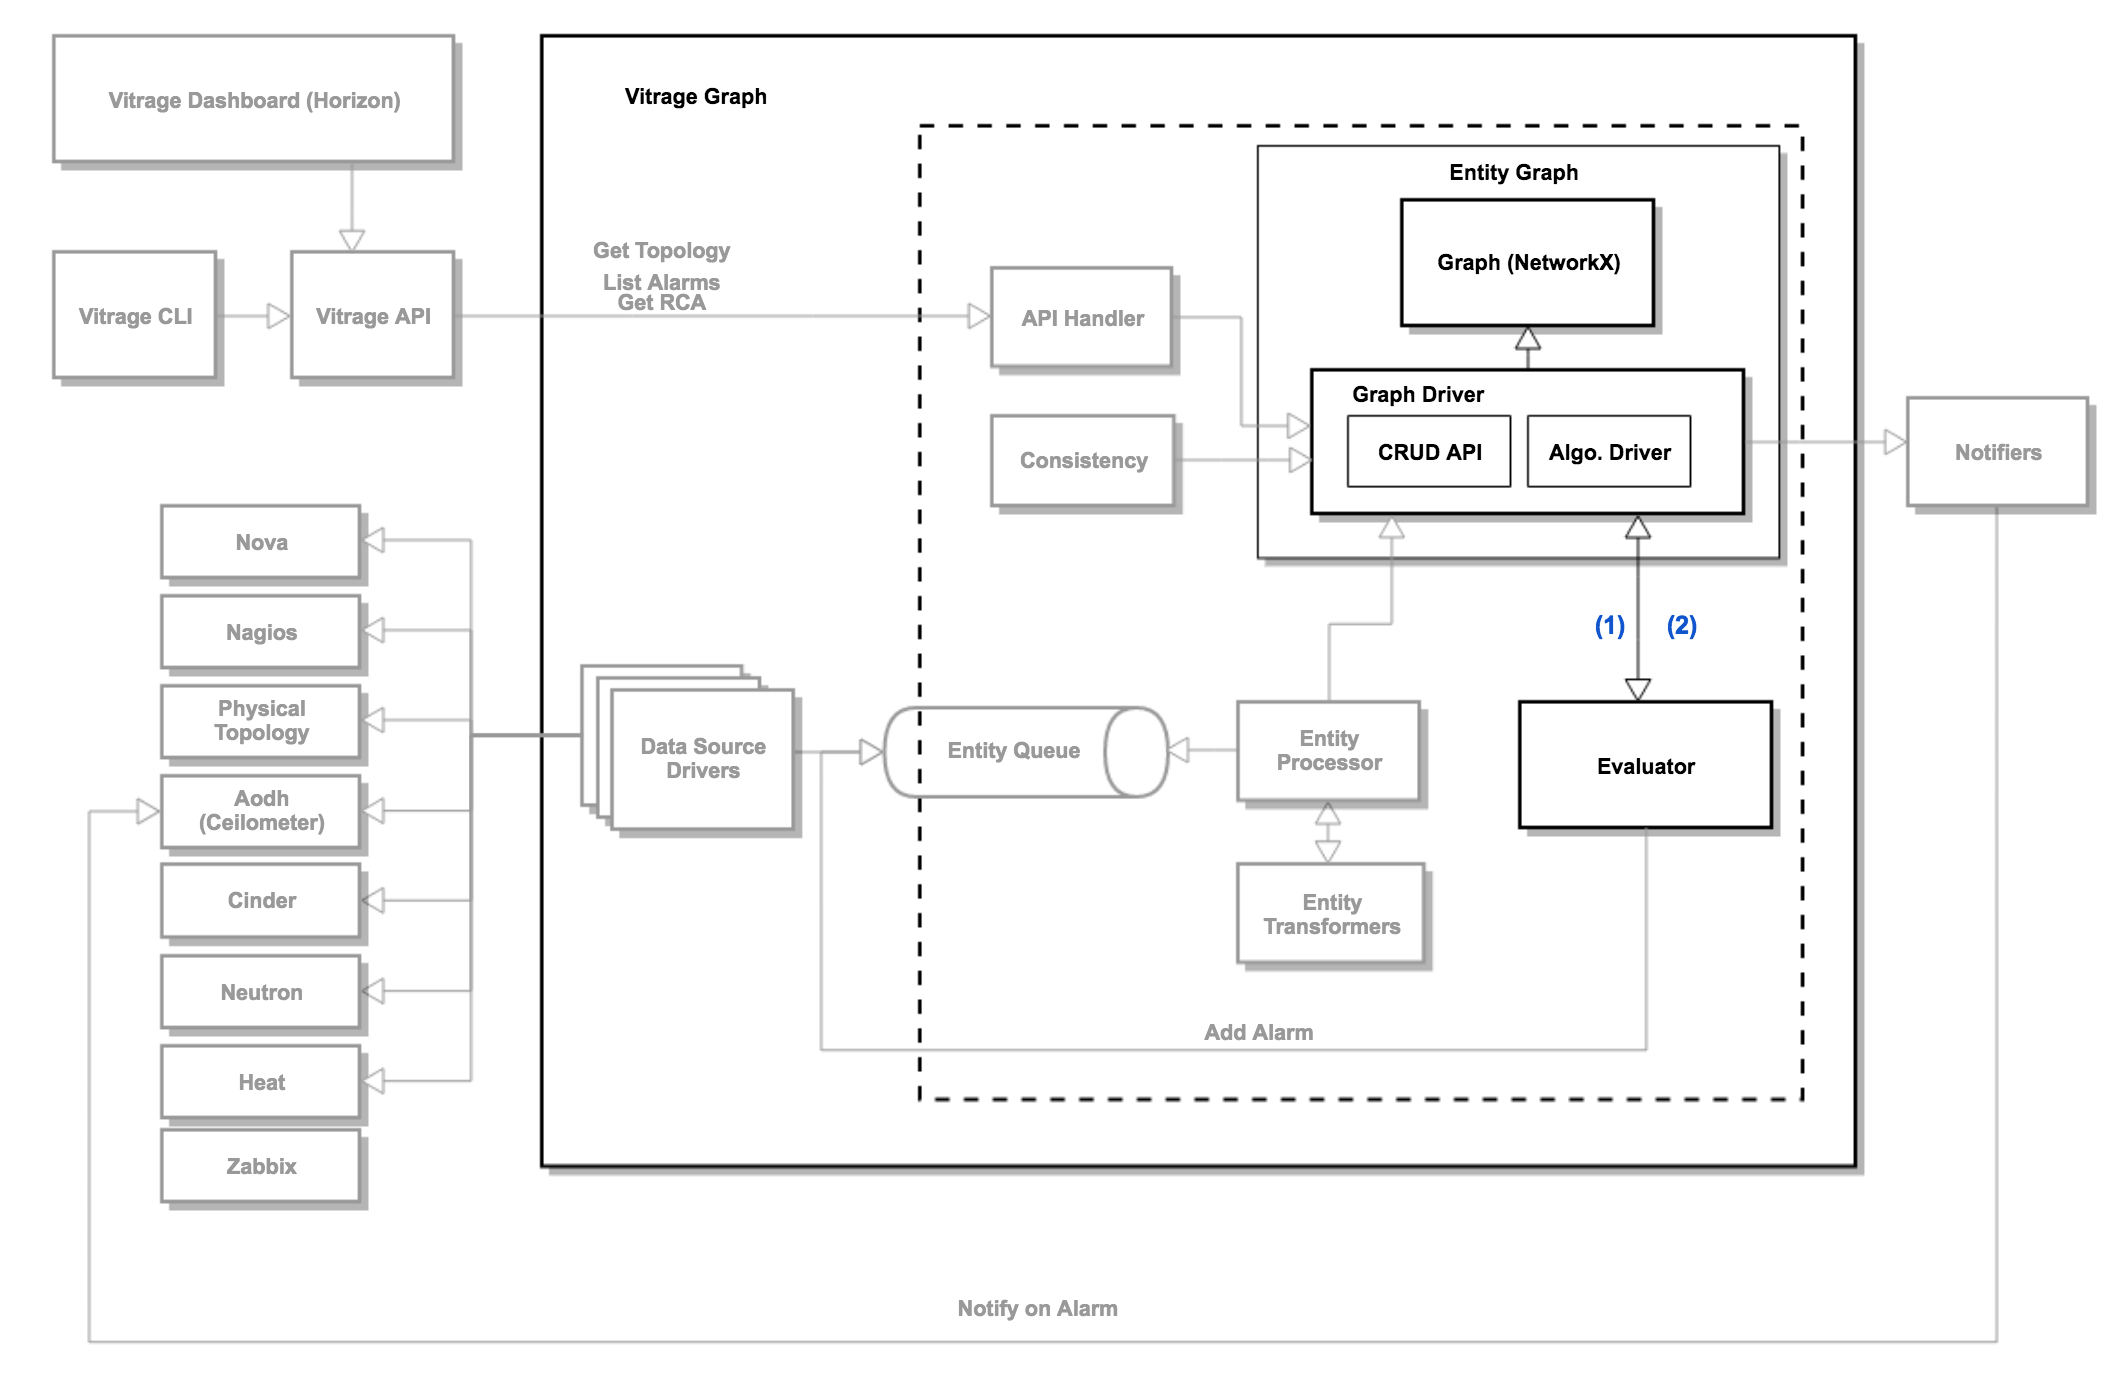
The Evaluator is notified of a new alarm Alarm-X.
The Evaluator evaluates the templates and the Graph, and decides that there is a root cause relation between Alarm-X and Alarm-Y. It adds a “causes” edge to the Graph
Note that in future versions the graph with RCA information may become more complex, for example: