6.10. Results of measuring performance of Cinder with Ceph backend
- Abstract
This document includes performance test results of Cinder service with Ceph as storage backend. All tests have been performed regarding Measuring performance of Cinder with Ceph backend
6.10.1. Environment description
6.10.1.1. Hardware configuration of each server
server |
name |
– |
– |
role |
ceph cluster member |
kubernetes cluster member |
|
vendor,model |
HP ProLiant DL380 Gen9 |
HP ProLiant DL380 Gen9 |
|
operating_system |
Ubuntu 16.04.1 LTS x86_64 |
Ubuntu 16.04.1 LTS x86_64 |
|
CPU |
vendor,model |
Intel(R) Xeon(R) E5-2680 v3 |
Intel(R) Xeon(R) E5-2680 v3 |
processor_count |
2 |
2 |
|
core_count |
12 |
12 |
|
frequency_MHz |
2500 |
2500 |
|
RAM |
vendor,model |
HP DIMM 16Gb 2133 MHz |
HP DIMM 16Gb 2133 MHz |
amount_GiB |
256 |
256 |
|
NETWORK |
interface_name |
p1p1 |
p1p1 |
vendor,model |
Intel X710 for 10GbE SFP+ |
Intel X710 for 10GbE SFP+ |
|
bandwidth |
10Gbit/s |
10Gbit/s |
|
STORAGE |
dev_name |
/dev/sd[a-k] |
/dev/sda |
vendor,model |
HP Smart Array Gen9 12xHDD SAS 15K EH0600JEDHE |
HP Smart Array Gen9 RAID10 12xHDD SAS 15K EH0600JEDHE |
|
SSD/HDD |
HDD |
HDD |
|
size |
600GB x 11 |
3600GB |
6.10.1.2. Configuration of physical network
All servers connected between themselves with 10G media. Logically environment network devided into 2 parts at L2 with vlans. First VLAN is for cluster interconnect and second is serving as a provider network for OpenStack cloud.
6.10.1.3. Ceph cluster configuration
Ceph cluster contains 3 hardware servers with identical configuration.
All servers configured in AIO manner - mon, osd & mds roles present on each of
these 3 servers. Each server has 10 x 600Gib volumes used by OSDs - 30 OSD total.
Ceph monitor instances - 3
Ceph OSDs - 30, 10 per cluster member, placement groups - 1984
- root@729346-comp-disk-348:~# ceph status
- cluster 0478bb62-4951-44fc-aecc-e5f1474bd00d
- health HEALTH_WARN
noscrub,nodeep-scrub,sortbitwise flag(s) set
- monmap e1: 3 mons at {729346-comp-disk-348=172.20.9.137:6789/0,729353-comp-disk-341=172.20.9.144:6789/0,729693-comp-disk-199=172.20.9.242:6789/0}
election epoch 6, quorum 0,1,2 729346-comp-disk-348,729353-comp-disk-341,729693-comp-disk-199
- osdmap e81: 30 osds: 30 up, 30 in
flags noscrub,nodeep-scrub,sortbitwise
- pgmap v670470: 1984 pgs, 9 pools, 2291 MB data, 300 objects
- 9236 MB used, 16599 GB / 16608 GB avail
1984 active+clean
6.10.1.4. Kubernetes + Calico configuration
Kubernetes deployed with Kargo on 6 hardware nodes.
Kargo installation topology of k8s by roles:
kube-master:
node1
node2
kube-node:
node1
node2
node3
node4
node5
node6
etcd:
node1
node2
node3
Calico k8s cni plugin configuration: Calico configured by Kargo and deployed with next configuration:
Calico container launched from systemd units as services on each node
Calico addressing configuration for k8s: ..
etcdctl –endpoint https://node1:2379 get /calico/v1/ipam/v4/pool/10.240.0.0-12
{“masquerade”: true, “cidr”: “10.240.0.0/12”}
6.10.1.5. OpenStack deployment configuration
OpenStack deployed using fuel-ccp
OpenStack roles topology:
roles:
node[1-3]:
controller
openvswitch
node[4-6]:
compute
openvswitch
OpenStack Cinder + Ceph configuration:
ceph:
  fsid: "0478bb62-4951-44fc-aecc-e5f1474bd00d"
  mon_host: "172.20.9.137"
cinder:
  ceph:
    enable: true
    pool_name: "volumes4"
    backup_pool_name: "backup4"
    username: "cinder4"
    key: "AQAKoUZYmYmDMxAAfD52DuUlghtH6bGSutTfnQ=="
    rbd_secret_uuid: "5d6e0775-c45b-4bf6-b9ac-460a3ccec127"
glance:
  ceph:
    enable: true
    pool_name: "images4"
    username: "glance4"
    key: "AQAKoUZYlZU6IxAA5B+sixBtz19hrjRwV2kUKA=="
nova:
  ceph:
    enable: true
    pool_name: "vms4"
More detailed information about services configuration and distribution
across nodes could be obtained from fuel-ccp configuration files:.
6.10.1.5.1. Test tools:
6.10.2. Testing process
6.10.2.1. Preparation
rally container setup - required for 1st test case where we are going to
test “control plane”.
openstackclient install - required for both cases.
openstack rc file preparation - required for both cases.
Upload ubuntu xenial cloud image in raw disk format.
5. Create and upload image with random data which will be used for prefilling of Cinder volumes.
6.10.2.2. Test Case 1
Launched 3 rally jobs where every next job uses parameters from previous one multiplied on two.
Example of Rally job execution
rally task start cinder30.yaml
6.10.2.3. Test Case 2
Spawn different amount of vms with cinder volumes attached using heat. Each next run spawn greater amount of concurrent vms which will produce concurrent loads.
Preparation of image with random data
dd if=/dev/urandom of=40g.data bs=1M count=40960 iflag=fullblock status=progress

openstack image create --container-format=bare --disk-format=raw --public --file 40g.data 40g-urandom
Prepared custom flavor for VMs
openstack flavor show m1.cinder
+----------------------------+--------------------------------------+
| Field                      | Value                                |
+----------------------------+--------------------------------------+
| OS-FLV-DISABLED:disabled   | False                                |
| OS-FLV-EXT-DATA:ephemeral  | 0                                    |
| access_project_ids         | None                                 |
| disk                       | 6                                    |
| id                         | 74eff70b-5f1e-44db-8248-90be0c57a18e |
| name                       | m1.cinder                            |
| os-flavor-access:is_public | True                                 |
| properties                 |                                      |
| ram                        | 2048                                 |
| rxtx_factor                | 1.0                                  |
| swap                       |                                      |
| vcpus                      | 1                                    |
+----------------------------+--------------------------------------+
Example of heat template execution - launch of tests
# 2 VMs R/W
# write
openstack stack create --parameter "image=xenial_raw;flavor=m1.cinder;key_name=admkey;volume_size=40;network_name=int-net;vm_count=1;test_iodepth=64;test_filesize=40G;test_mode=time;test_runtime=600;test_rw=randwrite" --template cinder-ceph-io/main.yaml cinderstack0
+---------------------+--------------------------------------+
| Field               | Value                                |
+---------------------+--------------------------------------+
| id                  | ae834cdc-35d3-4fc2-a0df-c8a4dfd499c9 |
| stack_name          | cinderstack0                         |
| description         | No description                       |
| creation_time       | 2016-12-27T16:15:26Z                 |
| updated_time        | None                                 |
| stack_status        | CREATE_IN_PROGRESS                   |
| stack_status_reason | Stack CREATE started                 |
+---------------------+--------------------------------------+
# read
openstack stack create --parameter "image=xenial_raw;flavor=m1.cinder;key_name=admkey;volume_size=40;network_name=int-net;vm_count=1;test_iodepth=64;test_filesize=40G;test_mode=time;test_runtime=600;test_rw=randread" --template cinder-ceph-io/main.yaml cinderstack1
+---------------------+--------------------------------------+
| Field               | Value                                |
+---------------------+--------------------------------------+
| id                  | bd9d923d-0571-4219-a639-071cf1d41cd3 |
| stack_name          | cinderstack1                         |
| description         | No description                       |
| creation_time       | 2016-12-27T16:15:28Z                 |
| updated_time        | None                                 |
| stack_status        | CREATE_IN_PROGRESS                   |
| stack_status_reason | Stack CREATE started                 |
+---------------------+--------------------------------------+
As a result of this part we got the following CSV files in following format
starttime,stoptime,jobname, read_iops,read_bandwidth,read_complelatency_mean,read_complelatency_min,read_complelatency_max,read_complelatency_95%ile,read_complelatency_99%ile,read_total_latency_avg,read_bandwidth_avg, write_iops,write_bandwidth,write_complelatency_mean,write_complelatency_min,write_complelatency_max,write_complelatency_95%ile,write_complelatency_99%ile,write_total_latency_avg,write_bandwidth_avg.
METRICS(NUMBER_OF_VM_WORKERS=2)
METRICS(NUMBER_OF_VM_WORKERS=4)
METRICS(NUMBER_OF_VM_WORKERS=10)
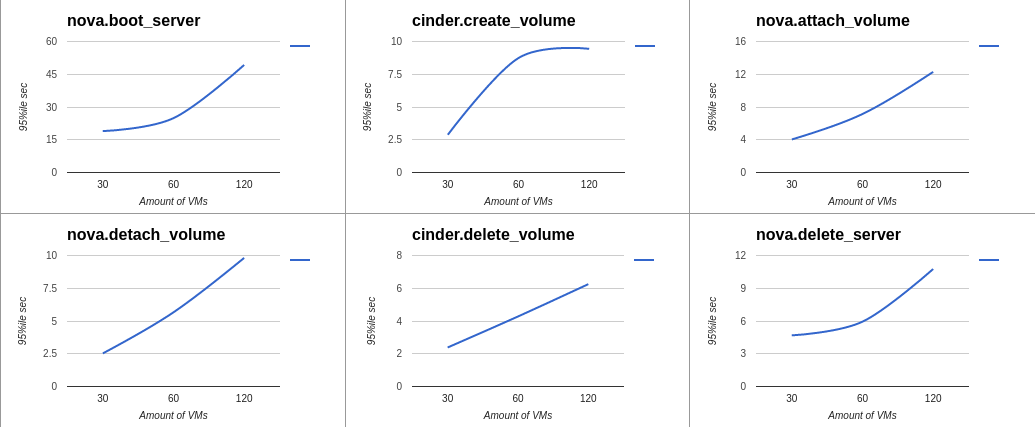
6.10.3. Results
6.10.3.1. Test Case 1
Summary table for Rally jobs launched with 30, 60 and 120 instances
Response Times (sec) |
||||||||
Action |
Min (sec) |
Median (sec) |
90%ile (sec) |
95%ile (sec) |
Max (sec) |
Avg (sec) |
Success |
Count |
nova.boot_server |
8.867 |
13.971 |
18.19 |
18.953 |
20.078 |
13.967 |
100.0% |
30 |
cinder.create_volume |
2.28 |
2.433 |
2.66 |
2.882 |
3.058 |
2.452 |
100.0% |
30 |
nova.attach_volume |
2.354 |
2.666 |
3.41 |
4.036 |
5.24 |
2.844 |
100.0% |
30 |
nova.detach_volume |
2.283 |
2.386 |
2.51 |
2.525 |
2.544 |
2.394 |
100.0% |
30 |
cinder.delete_volume |
0.268 |
2.187 |
2.324 |
2.383 |
2.419 |
2.157 |
100.0% |
30 |
nova.delete_server |
2.326 |
2.509 |
4.607 |
4.683 |
4.771 |
2.839 |
100.0% |
30 |
total |
17.362 |
23.35 |
28.268 |
28.455 |
28.987 |
23.654 |
100.0% |
30 |
nova.boot_server |
10.719 |
19.401 |
24.605 |
24.891 |
26.366 |
18.951 |
100.0% |
60 |
cinder.create_volume |
2.281 |
3.148 |
8.412 |
8.74 |
8.993 |
4.188 |
100.0% |
60 |
nova.attach_volume |
2.388 |
4.55 |
6.909 |
7.142 |
9.588 |
4.544 |
100.0% |
60 |
nova.detach_volume |
2.308 |
2.603 |
4.842 |
5.663 |
6.485 |
3.304 |
100.0% |
60 |
cinder.delete_volume |
2.132 |
2.197 |
2.414 |
4.275 |
6.261 |
2.415 |
100.0% |
60 |
nova.delete_server |
2.38 |
2.798 |
5.11 |
5.937 |
8.817 |
3.802 |
100.0% |
60 |
total |
22.144 |
34.618 |
42.993 |
43.782 |
44.018 |
34.205 |
100.0% |
60 |
nova.boot_server |
16.817 |
29.559 |
39.734 |
49.257 |
78.91 |
31.29 |
100.0% |
120 |
cinder.create_volume |
2.377 |
6.364 |
9.192 |
9.441 |
11.667 |
6.66 |
100.0% |
120 |
nova.attach_volume |
2.57 |
7.196 |
11.151 |
12.285 |
17.159 |
7.228 |
100.0% |
120 |
nova.detach_volume |
2.308 |
4.897 |
8.617 |
9.816 |
11.4 |
5.218 |
100.0% |
120 |
cinder.delete_volume |
0.359 |
2.3 |
4.563 |
6.25 |
7.456 |
2.928 |
100.0% |
120 |
nova.delete_server |
2.372 |
4.942 |
8.401 |
10.761 |
15.516 |
5.357 |
100.0% |
120 |
total |
31.509 |
53.733 |
68.212 |
73.372 |
109.88 |
55.682 |
100.0% |
120 |
6.10.3.1.1. HTML reports generated by Rally
6.10.3.1.2. Graphs which shows time dependecy from amount of instances
6.10.3.2. Test Case 2
Simultaneous run of equal amount random read and write operations. All raw data and graphs could be obtained from - Tests results spreadsheet.
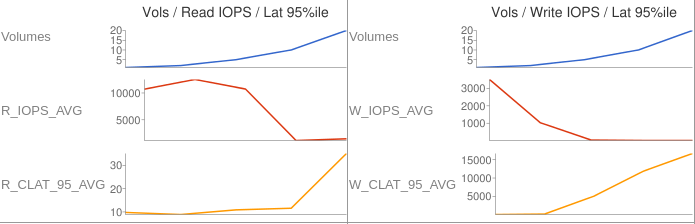
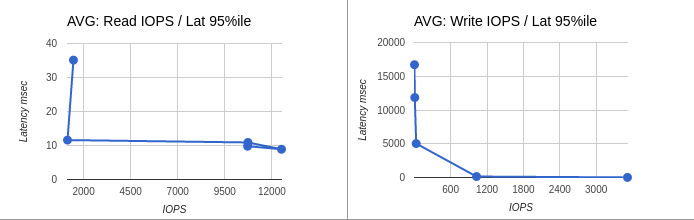
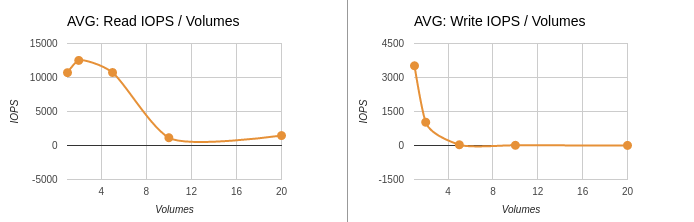
6.10.3.2.1. Average data
Table represents average results of mesurments made inside each consumer. This means that each row in the table below contains data from equal amount of consumers which were running at the same time and were producing read and write operations.
Latency displayed in milliseconds and represents value of 95th percentile.
nodes
count
|
test duration
time in sec
|
average
IOPS
READ
|
average
IOPS
WRITE
|
average
latency
READ
|
average
latency
WRITE
|
|---|---|---|---|---|---|
2 |
600 |
10711 |
3517 |
9.792 |
13.76 |
4 |
600 |
12512 |
1027 |
8.896 |
143.104 |
10 |
600 |
10730 |
32 |
12.582 |
5026.611 |
20 |
600 |
1143 |
9 |
11.597 |
11848.909 |
40 |
600 |
1460 |
4 |
35.117 |
16711.68 |
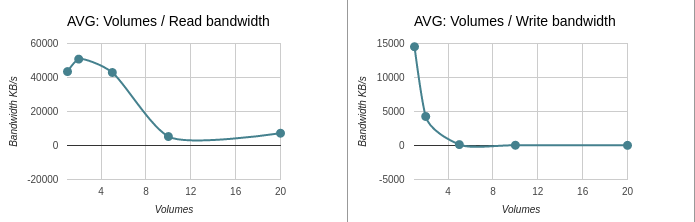
6.10.3.2.2. Graphs for average results
Average data: Volumes / IOPS / Latency 95%ile
Average data: IOPS / Latency 95%ile
Average data: IOPS / Volumes
Average data: IOPS / Bandwidth
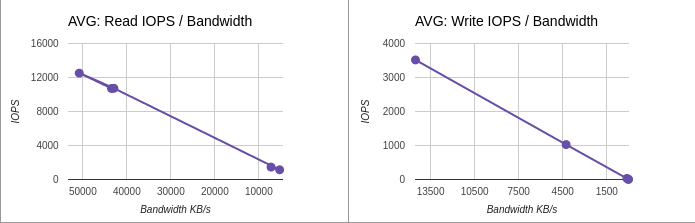
Average data: Volumes / Bandwidth
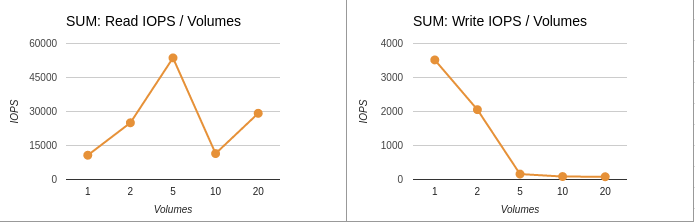
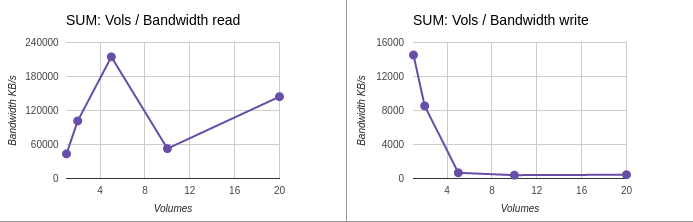
6.10.3.2.3. Summary data
Here represented data from aggregated values.
nodes
count
|
test duration
time in sec
|
SUM
IOPS
READ
|
SUM
IOPS
WRITE
|
|---|---|---|---|
2 |
600 |
10711 |
3517 |
4 |
600 |
25024 |
2054 |
10 |
600 |
53652 |
160 |
20 |
600 |
11437 |
87 |
40 |
600 |
29203 |
81 |
6.10.3.2.4. Graphs for summary results
Summary data: IOPS / Volumes
Summary data: Volumes / Bandwidth
6.10.4. Issues which have been found during the tests
6.10.4.1. Ceph performance degradation due to use of non optimal configuration
Down below displayed couple of raw data entries as from test results as from Ceph log files. This data shows that Ceph began to block serving of requests due to lack of placemnent groups and grown amount of concurrent read/write requests.
Data from tests:
2016.12.28-13:48:24 2016.12.28-13:58:37     time-vm-randwrite-16_fio        0       0       0       0       0       0       0       0       0       3       14      18258.5785      60.418  27027.923       16711.68        16711.68        18258.6123      14.723724
2016.12.28-13:47:34 2016.12.28-13:57:57     time-vm-randwrite-17_fio        0       0       0       0       0       0       0       0       0       4       16      15692.7769      73.15   47574.579       16711.68        16711.68        15692.8036      17.715092
2016.12.28-13:51:36 2016.12.28-14:01:39     time-vm-randwrite-18_fio        0       0       0       0       0       0       0       0       0       6       27      9373.5427       7.837   27200.956       16711.68        16711.68        9373.5793       35.894502
2016.12.28-13:50:27 2016.12.28-14:00:28     time-vm-randread-19_fio 347     1391    183.965 0.071   45620.107       21.888  6455.296        183.9819        1791.505108     0       0       0       0       0
2016.12.28-13:52:05 2016.12.28-14:02:05     time-vm-randread-1_fio  1309    5237    48.8591 0.199   45945.681       18.304  23.68   48.8754 6672.371367     0       0       0       0       0
2016.12.28-13:52:37 2016.12.28-14:02:37     time-vm-randread-2_fio  1443    5773    44.3222 0.085   42175.723       22.4    25.216  44.3394 7158.120545     0       0       0       0       0
Data from Ceph logs:
Wed Dec 28 13:53:47 UTC 2016 cluster 0478bb62-4951-44fc-aecc-e5f1474bd00d health HEALTH_WARN 297 requests are blocked > 32 sec noscrub,nodeep-scrub,sortbitwise flag(s) set monmap e1: 3 mons at {729346-comp-disk-348=172.20.9.137:6789/0,729353-comp-disk-341=172.20.9.144:6789/0,729693-comp-disk-199=172.20.9.242:6789/0} election epoch 6, quorum 0,1,2 729346-comp-disk-348,729353-comp-disk-341,729693-comp-disk-199 osdmap e82: 30 osds: 30 up, 30 in flags noscrub,nodeep-scrub,sortbitwise pgmap v691525: 1984 pgs, 9 pools, 127 GB data, 27911 objects 393 GB used, 16214 GB / 16608 GB avail 1984 active+clean client io 216 MB/s rd, 206 MB/s wr, 1193 op/s rd, 271 op/s wr
Wed Dec 28 13:54:23 UTC 2016 cluster 0478bb62-4951-44fc-aecc-e5f1474bd00d health HEALTH_WARN 145 requests are blocked > 32 sec noscrub,nodeep-scrub,sortbitwise flag(s) set monmap e1: 3 mons at {729346-comp-disk-348=172.20.9.137:6789/0,729353-comp-disk-341=172.20.9.144:6789/0,729693-comp-disk-199=172.20.9.242:6789/0} election epoch 6, quorum 0,1,2 729346-comp-disk-348,729353-comp-disk-341,729693-comp-disk-199 osdmap e82: 30 osds: 30 up, 30 in flags noscrub,nodeep-scrub,sortbitwise pgmap v691534: 1984 pgs, 9 pools, 136 GB data, 30138 objects 420 GB used, 16187 GB / 16608 GB avail 1984 active+clean client io 233 MB/s rd, 226 MB/s wr, 1407 op/s rd, 295 op/s wr
Wed Dec 28 13:55:30 UTC 2016 cluster 0478bb62-4951-44fc-aecc-e5f1474bd00d health HEALTH_WARN 280 requests are blocked > 32 sec noscrub,nodeep-scrub,sortbitwise flag(s) set monmap e1: 3 mons at {729346-comp-disk-348=172.20.9.137:6789/0,729353-comp-disk-341=172.20.9.144:6789/0,729693-comp-disk-199=172.20.9.242:6789/0} election epoch 6, quorum 0,1,2 729346-comp-disk-348,729353-comp-disk-341,729693-comp-disk-199 osdmap e82: 30 osds: 30 up, 30 in flags noscrub,nodeep-scrub,sortbitwise pgmap v691547: 1984 pgs, 9 pools, 148 GB data, 33162 objects 454 GB used, 16153 GB / 16608 GB avail 1984 active+clean client io 262 MB/s rd, 248 MB/s wr, 1472 op/s rd, 320 op/s wr
Wed Dec 28 13:56:14 UTC 2016 cluster 0478bb62-4951-44fc-aecc-e5f1474bd00d health HEALTH_WARN 240 requests are blocked > 32 sec noscrub,nodeep-scrub,sortbitwise flag(s) set monmap e1: 3 mons at {729346-comp-disk-348=172.20.9.137:6789/0,729353-comp-disk-341=172.20.9.144:6789/0,729693-comp-disk-199=172.20.9.242:6789/0} election epoch 6, quorum 0,1,2 729346-comp-disk-348,729353-comp-disk-341,729693-comp-disk-199 osdmap e82: 30 osds: 30 up, 30 in flags noscrub,nodeep-scrub,sortbitwise pgmap v691560: 1984 pgs, 9 pools, 160 GB data, 36160 objects 490 GB used, 16117 GB / 16608 GB avail 1984 active+clean client io 215 MB/s rd, 202 MB/s wr, 1282 op/s rd, 266 op/s wr
tbitwise pgmap v691562: 1984 pgs, 9 pools, 161 GB data, 36591 objects 495 GB used, 16112 GB / 16608 GB avail 1984 active+clean client io 257 MB/s rd, 246 MB/s wr, 1591 op/s rd, 304 op/s wr
Explanation of data from above:
- 1.Time period got from last test run, where were spawned 40 VMs / consumers.
20 for read and 20 for write tests running in concurrent mode. Each test cycle duration is equals 600 seconds - 10 minutes. From test logs we see that all VMs were spawned with small time difference and have about 70% of intersection. During this period of time VMs were producing loads on storage subsystem.
- 2.Amount of IOPS are lowered for both read and write operations. From test logs
we see that for write they are: 3, 4, 6 and for read: 347, 1309, 1443.
- 3.IOPS values in case of read operations are higher then in case of write operations
due to RAID controller cache on Ceph cluster nodes and usage of one image for all volumes used in all tests.
- 4.Ceph log files show that during time when tests were running load on Ceph reached
configuration limitaions and Ceph began to block requests. In log files it repsesented with entries containign this - 240 requests are blocked > 32 sec.
6.10.5. Applications
6.10.5.1. Sofware versions used during tests
software |
version |
source |
|---|---|---|
jewell |
Debian jessie ceph package repository v10.2.3 |
|
master |
From sources commit a62f74259c8df233b177f7853a178bcbb7d9ef43 |
|
1.4.3 |
quay.io/coreos/hyperkube:v1.4.3_coreos.0 |
|
0.22.0 |
docker hub calico/node |
|
1.0.0-beta |
docker hub calico/ctl |
|
master |
From sources commit f4afa36d9097c5860fa8ee9c2726236e7de83a27 |
|
newton |
From sources |
|
0.7.1~dev176 |
docker hub rallyforge/rally |
|
2.2.10 |
Ubuntu 16.04 Xenial package repository |
